Table of Contents
The US30, also known as the Dow Jones Industrial Average (DJIA), is a popular index comprising 30 prominent publicly traded companies in the United States. Many traders are interested in trading US30 due to its volatility and liquidity. This guide will explain how to add US30 to your MetaTrader platform and explore two trading strategies for this index.
Please check my video with a detailed explanation:


How to Add US30 to Your MetaTrader Platform?
Adding the US30 index to your MetaTrader platform is straightforward, but depending on your broker’s settings, it may not be visible by default.
Here’s how to do it:

Step 1: Access MetaTrader’s Symbols
- Open your MetaTrader platform.
- Navigate to the top menu and click on View.
- From the drop-down menu, select Symbols.
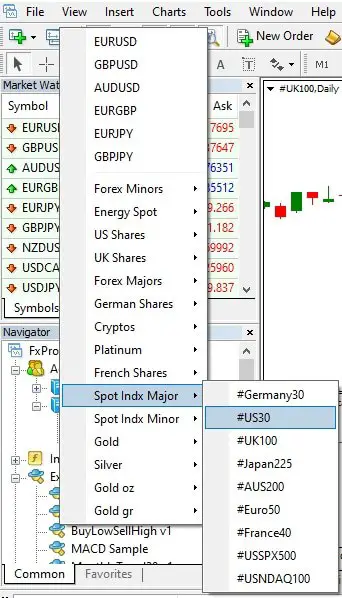
Step 2: Find US30 in the List
- In the Symbols window, you will see a list of asset classes such as Forex, Indices, Commodities, etc.
- Look for the Indices section, which may also be labeled “CFD Indices” or something similar, depending on your broker.
- Scroll down until you find the US30 or the US Dow Jones 30 Index.
Step 3: Show US30 in the Market Watch
- Once you locate US30, click on it and then select Show Symbol. This will make the asset visible in your Market Watch window.
- Close the Symbols window.
Step 4: Open US30 Chart
- Go to the Market Watch window on the left side of your screen.
- Right-click on US30 in the Market Watch.
- Select Chart Window to open a live price chart for the US30 index.
Now that you have added US30 to your MetaTrader platform, you can begin analyzing its price action and trading.
Trading Strategies for US30
Trading the US30 can be highly profitable due to its volatility and liquidity. Let’s explore two popular strategies that you can use: a long-term trend-following strategy and a short-term intraday strategy.
Strategy 1: Trend Following Using Channels (For Long-Term Traders)
The first strategy is ideal for long-term traders who want to capitalize on sustained price trends. This strategy involves using price channels and a 200-period Simple Moving Average (SMA) to filter out potential trades.
Step 1: Add the Channel
- Add a price channel indicator to your chart or draw the channel manually by connecting price highs and lows to form upper and lower channel boundaries.
- The channel will help you identify the market’s general direction, whether it’s trending up or down.
Step 2: Identify Buying Opportunities
- Buy Below the Channel: When the price touches or falls below the channel’s lower boundary and remains above the 200-period SMA, it signals a potential buying opportunity.
- Historically, US30 tends to rise over time due to the performance of the 30 largest companies, making long-term buying positions more favorable.
Step 3: Monitor the 200 SMA
- The 200-period SMA is critical for identifying bullish or bearish market conditions. When the price is above the SMA, the market is bullish, and you should focus on buying opportunities.
- If the price breaks below the SMA, it signals a possible trend reversal, and you can prepare for short positions.
Example: In 2023, US30 recovered in the latter part of the year. Traders could have entered long positions when the price fell below the channel line but remained above the 200 SMA, capitalizing on the upward trend.
Strategy 2: Intraday Trading Using Fibonacci Retracements (For Short-Term Traders)
If you prefer short-term or intraday trading, you can use Fibonacci retracement levels combined with the Relative Strength Index (RSI) to spot buying and selling opportunities.
Step 1: Apply Fibonacci Retracement
- Draw Fibonacci retracement levels by identifying recent high and low prices. The key levels to watch are 23.6%, 38.2%, 50%, and 61.8%.
- Use these levels to anticipate pullbacks or continuations in the price trend.
Step 2: Use RSI for Confirmation
- Add the RSI indicator to your chart and look for overbought or oversold conditions. A reading below 30 suggests oversold conditions (potential buy), while a reading above 70 indicates overbought conditions (potential sell).
Step 3: Trade Based on Fibonacci Levels
- Buy at 50% or 61.8% Retracement Levels: If the price returns to these levels during an uptrend and the RSI confirms an oversold condition (below 30), consider entering an extended position.
- Sell at the 50% or 61.8% Retracement Levels: In a downtrend, if the price retraces to these levels and the RSI shows overbought conditions (above 70), consider entering a short position.
Example: In October 2023, US30 experienced a price drop followed by a retracement to the 50% Fibonacci level. The RSI dipped below 30, confirming an oversold condition, and the price reversed upward, providing a clear buy signal.
Additional Tips for Trading US30
- Use Trendlines: Drawing trendlines on different time frames can help you identify significant support and resistance levels. Trading around these levels gives you an edge in anticipating price reversals.
- Focus on Highs and Lows: The previous day’s high and low, the previous week’s high and low, and the previous month’s high and low are crucial for intraday and swing traders. These levels often act as support or resistance and can be used to trigger trades.
- Switch Between Bullish and Bearish Bias: If the market conditions change, such as a trendline break or moving average cross, you can switch from a bullish to a bearish bias (or vice versa) to align with the current market sentiment.
Conclusion
Trading the US30 on MetaTrader is accessible to both long-term and short-term investors, depending on your chosen strategy. For long-term traders, using channels and the 200-period SMA to follow trends can offer consistent returns. Fibonacci retracement levels and RSI offer excellent opportunities for intraday traders to catch short-term price movements.
By adding US30 to your MetaTrader platform and applying these strategies, you can effectively participate in trading one of the world’s most iconic indices.

He is an expert in financial niche, long-term trading, and weekly technical levels.
The primary field of Igor's research is the application of machine learning in algorithmic trading.
Education: Computer Engineering and Ph.D. in machine learning.
Igor regularly publishes trading-related videos on the Fxigor Youtube channel.
To contact Igor write on:
igor@forex.in.rs
