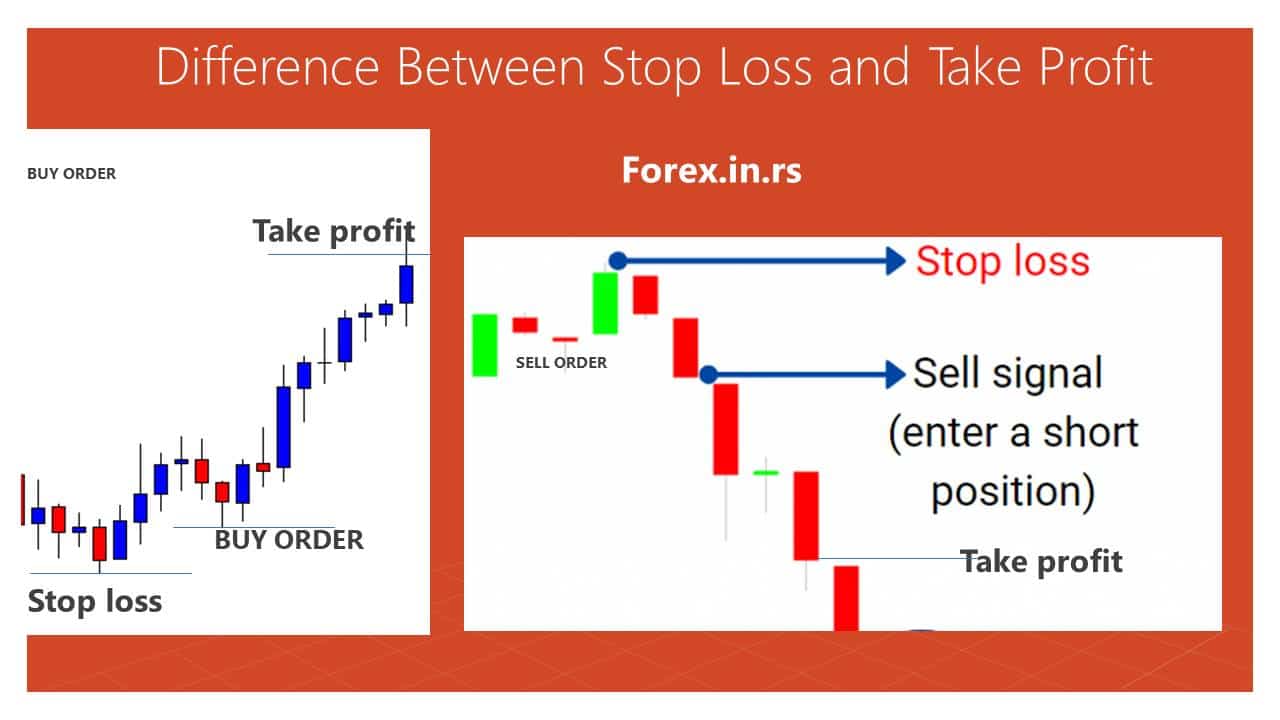
One critical component of strategic trading involves implementing exit price levels designed to limit potential losses or secure profits when specific price targets are reached. These exit strategies, namely stop loss and target price strategies, are fundamental elements of risk management and can significantly influence a trader’s success or failure.
Stop loss and target price levels are predetermined points set by traders in their orders to automatically close a position, either to limit a loss or to lock in a profit. These tools act as safety nets, providing traders with a level of protection against unpredictable swings in market prices.
A stop-loss order is a defensive mechanism that limits traders’ potential losses if the market moves against their position. It’s a predetermined price level at which a trade will be automatically closed if the price drops below it. It assures traders that they have a built-in plan to manage risk by capping the maximum loss they can incur on a trade.
On the other hand, a target price level, often referred to as a take-profit order, sets the price at which a trader wants to close a position for a profit. Once reached, this is a predetermined level that will trigger an automatic sale of the asset, ensuring that the trader captures a particular profit before the market has a chance to reverse.
Together, these trading tactics provide a systematic approach to risk management. By clearly defining their exit strategies, traders can mitigate emotional decision-making and potential market volatility, offering greater control over their trading outcomes. They form a crucial aspect of any robust trading strategy, helping to balance potential returns against the risks of unpredictable market movements.
What is the Best Forex Exit Indicator?
The latest quantitative research shows that the best forex exit indicator is the previous high or low price. However, in various strategies, traders can use Fibonacci levels, Pivot Points, moving average cross-overs, oscillator levels such as RSI (30,50,70), etc.

The primary goal of every forex trader is to predict the future price movements of currency pairs correctly. This prediction’s effectiveness often lies in identifying key entry and exit points, which can be detected using various forex indicators. Based on recent quantitative research, the previous high or low price point has emerged as a reliable exit indicator. However, traders often utilize an array of indicators in their strategies, including Fibonacci levels, Pivot Points, moving average cross-overs, and oscillator levels, such as RSI levels (30,50,70), to optimize their exit strategies.
1. Previous High or Low:
Traders consider the previous high or low as a potent exit indicator. It represents the highest and lowest prices at which a security has traded in the prior trading period. These levels often act as a psychological threshold for market participants. For example, if the price of a currency pair rises and crosses its previous high, it could signal a continuation of the bullish trend, prompting a trader to exit a short position. Conversely, if the price drops below its previous low, it might indicate a continuing bearish trend, suggesting an exit from an extended position.
2. Fibonacci Levels:
Fibonacci retracement levels are an influential tool traders use to predict potential support and resistance levels, which can serve as exit points. These levels are identified by pinpointing a recent trend’s high and low and then marking the key Fibonacci ratios of 23.6%, 38.2%, 50%, 61.8%, and 78.6% horizontally on the chart to produce a grid. Traders watch These levels closely, as they often correspond to strategic price reversals.
3. Pivot Points:
Traders use pivot points to determine potential support and resistance levels. They are calculated using the previous trading session’s high, low, and closing prices. Traders use these pivot points to identify potential price reversals, making them excellent exit point indicators. The primary pivot point (PP) is the most critical dividing line between bullish and bearish market sentiment.
4. Moving Average Cross-Overs:
Moving averages smooth out short-term price fluctuations and highlight long-term trends or cycles. When a shorter-period moving average crosses above a longer-period moving average, it generates a bullish signal, indicating it may be a good time to exit a short position. Conversely, when a shorter-period moving average crosses below a longer-period moving average, it produces a bearish signal, suggesting it may be an opportune time to exit an extended position.
5. Oscillator Levels – RSI Levels (30,50,70):
The Relative Strength Index (RSI) is a momentum oscillator that measures the speed and change of price movements. The RSI generates a reading between 0 and 100, with levels below 30 often interpreted as an oversold condition (potentially signaling a bullish reversal – hence a good exit point for short positions), and levels above 70 seen as overbought (potentially signaling a bearish reversal – a good exit point for long positions). The 50 level often confirms the trend, where readings above 50 signal a bullish market and, below 50, a bearish market.
In summary, traders incorporate diverse indicators to identify robust exit points that align with their trading strategy and risk tolerance. Each of these indicators has its strengths and limitations, and their effectiveness may vary depending on market conditions and the currency pair being traded. Hence, traders often employ a combination of these tools to strengthen their market analysis and decision-making process.


