Forex traders often use scalping and 1-minute charts because they aim to make numerous small profits throughout the trading day, capitalizing on minor price movements. This strategy requires quick decision-making and the ability to enter and exit trades rapidly, which the 1-minute chart facilitates by providing detailed, real-time data. Scalping can help reduce exposure to market risks since trades are held for a concise duration. Additionally, this method can be effective in highly liquid markets like forex, where small price changes occur frequently. Lastly, the 1-minute chart helps traders exploit high-frequency trading opportunities and market inefficiencies that might not be visible on longer timeframes.
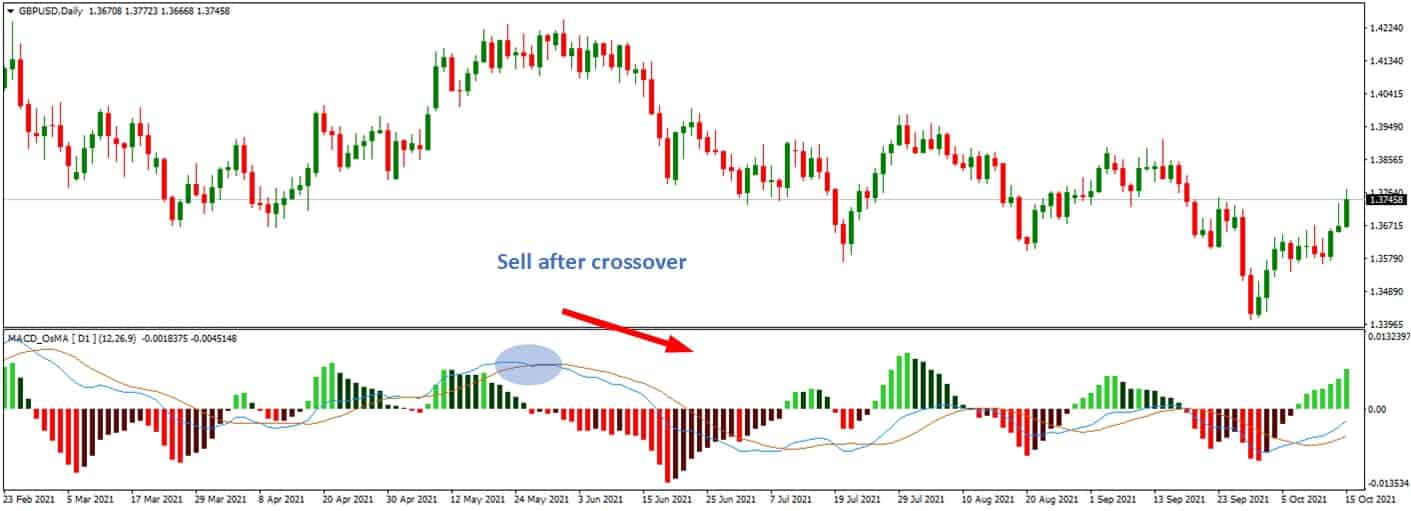
The MACD (Moving Average Convergence Divergence) indicator is a popular tool among forex traders, handy for predicting market trends and potential reversals. It consists of two moving averages, typically the 12-day and 26-day EMAs (Exponential Moving Averages), which help to smooth out price data and highlight trends. The MACD line is derived from the difference between these two moving averages, while the signal line, usually a 9-day EMA of the MACD line, is used to generate buy and sell signals.
When the MACD line crosses above the signal line, it indicates a potential buying opportunity, while a cross below suggests a selling opportunity. Additionally, the MACD histogram, representing the difference between the MACD line and the signal line, visually represents momentum. Given your interest in forex and trading, the MACD indicator can be a valuable tool to help you identify market trends and make more informed trading decisions, potentially improving your ability to time the market more effectively, especially in the volatile forex environment.

Now, let us go back to my case study!
What are the best settings for the 1-minute chart?
The best MACD settings for a 1-minute chart, using parameters 24, 52, and 18, have demonstrated a 1.5% better performance than the default settings of 12, 26, and 9. These adjusted parameters help better capture the short-term market movements typical in scalping strategies on a 1-minute chart.
Of course, during the testing, we removed all spread costs by a substantial amount.
Experiment Case Study for 1-Minute Chart Best Settings Testing
Indicators Used:
- MACD with Several Settings: We tested different combinations of the MACD indicator, including fast EMA settings of 12, 24, and 6; slow EMA settings of 26, 52, and 34; and MACD SMA settings of 5, 9, and 18.
- Channel Indicator: We used our custom channel indicator for this experiment, but any channel indicator, like the Donchian channel, can be used.
- Important Level Indicator: Our indicator is based on previous highs and lows. Alternatives such as Pivot points or Fibonacci levels can also be used.
Trading Rules on 1-Minute Charts:
BUY Rules:
- MACD Signal: Enter a buy trade if there is a bullish MACD cross or a cross above the zero line.
- Significant Level Touch: Ensure the price touches a significant level identified by the critical level indicator.
- Bullish Channel: Verify that the price is within a bullish channel.
- Stop Loss: Place the stop loss at the last significant level swing.
- Target: Set the target at the next significant level.
SELL Rules:
- MACD Signal: Enter a sell trade if there is a bearish MACD cross or a cross below the zero line.
- Significant Level Touch: Ensure the price touches a critical level identified by the significant level indicator.
- Bearish Channel: Verify that the price is within a bearish channel.
- Stop Loss: Place the stop loss at the last significant level swing.
- Target: Set the target at the next significant level.
Combinations Tested:
- Fast EMA: 12, 24, 6
- Slow EMA: 26, 52, 34
- MACD SMA: 5, 9, 18
The Best MACD Settings for Intraday Trading – Case Study Video recapitulation is presented below:
Results: The study involved testing various combinations of the MACD settings to identify the optimal parameters for 1-minute chart trading. Each combination was evaluated based on the following criteria:
- Signal Accuracy: The accuracy of buy and sell signals generated by each MACD setting combination.
- Profitability: The overall profitability of trades executed using the specified rules.
- Risk Management: The effectiveness of stop loss and target settings in minimizing losses and maximizing gains.
By systematically testing these combinations, we aimed to determine the MACD settings that provided the best accuracy, profitability, and risk management performance on 1-minute charts.


