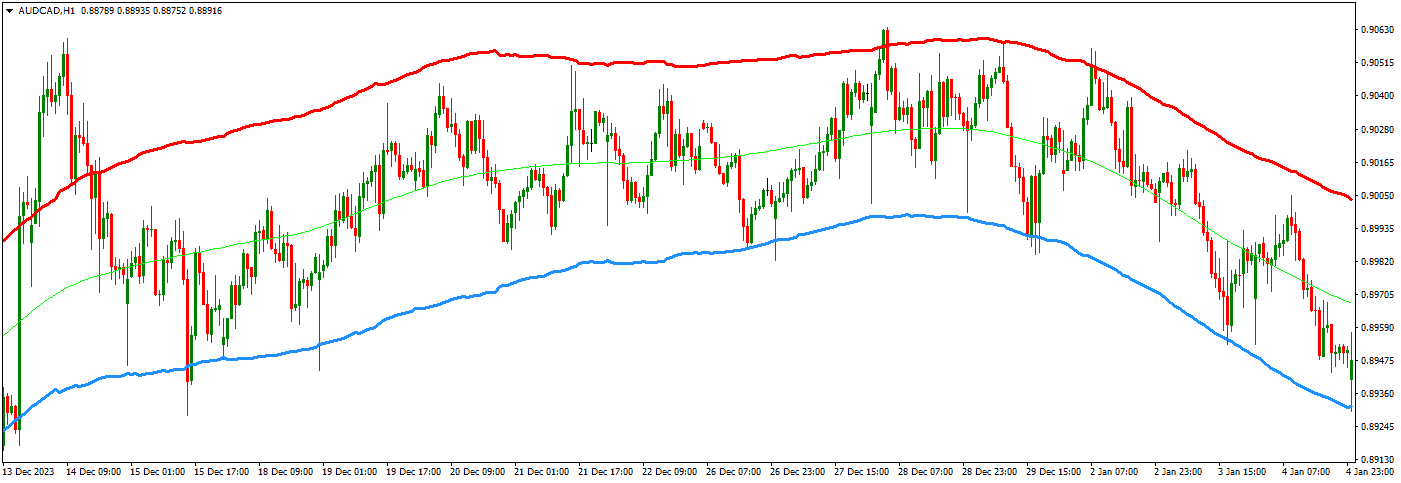
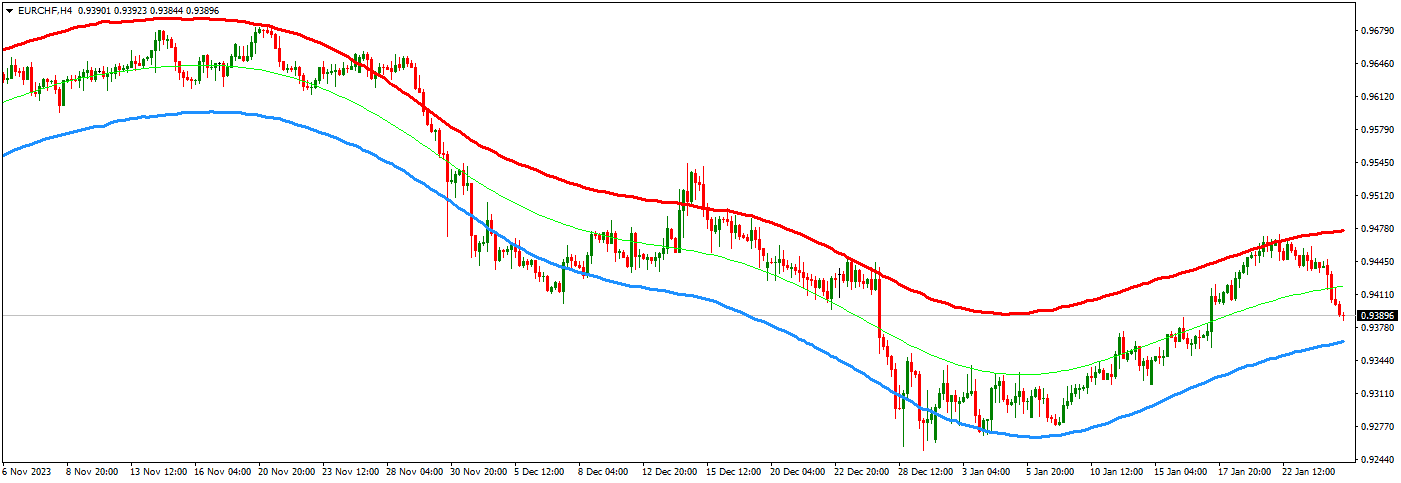
Mean reversion trading strategies in the forex market aim to identify currency pairs that have moved away from their historical average exchange rates and are likely to revert to their mean or equilibrium levels.
- Mean reversion is a statistical concept that suggests prices move away from their average or “mean” value in the short term but eventually revert to that mean in the long term.
- It implies that extreme price movements, whether up or down, will likely be followed by a correction in the opposite direction.
- Mean reversion is based on the assumption that markets exhibit cyclical behavior and tend to return to their historical norms over time.

Try a mean reversion strategy and get a template, indicators, and strategy guide.
In the last several years, the best forex pairs for the mean reversion strategy have been AUDCAD, NZDCAD, AUDNZD, EURCHF, and other low-volatility pairs. Touching low and high boundaries makes some forex pairs more predictable.
AUDCAD, NZDCAD, AUDNZD, EURCHF, and others have been favored for mean reversion strategies due to their stability, consistent range-bound behavior, and reduced risk. These characteristics make it easier for traders to identify and profit from price reversals.
The preference for specific forex pairs, such as AUDCAD, NZDCAD, AUDNZD, EURCHF, and other low volatility pairs, in mean reversion strategies over the last several years can be attributed to several factors:
- Stability and Low Volatility: Mean reversion strategies are more effective in stable and lower volatility markets. These currency pairs tend to have smoother price movements and are less prone to sudden, erratic price spikes or crashes. This stability makes it easier for traders to identify overextended price levels and anticipate reversals.
- Consistent Range-Bound Behavior: Currency pairs that trade within well-defined ranges are suitable for mean reversion strategies. These pairs often oscillate around their mean values, creating opportunities for traders to profit from price reversals when they deviate too far from the mean.
- Economic Correlations: Some mentioned pairs, like AUDCAD and NZDCAD, often have solid economic correlations due to their proximity and trade relationships. This correlation can contribute to more predictable price movements, which can be advantageous for mean reversion trading.
- Relative Economic Stability: Currency pairs involving currencies from countries with relatively stable economies and monetary policies may exhibit mean reversion behavior more consistently. Economic stability can lead to smoother price trends that revert to their historical means.
- Reduced Risk: Lower volatility pairs are generally considered less risky, which can appeal to traders who prefer a more conservative approach. Mean reversion strategies in low volatility pairs may have a lower risk of sudden adverse price movements.
- Long-Term Trends: In the case of EURCHF, the Swiss Franc (CHF) is known for its safe-haven status, and the Euro (EUR) is a widely traded currency. Combining these factors can result in more stable, less volatile price movements, making it conducive to mean reversion strategies.

Strategy: Bollinger Bands Mean Reversion Strategy
Objective: To profit from the mean reversion behavior of stock prices using Bollinger Bands as an indicator.
Indicators Used:
- Bollinger Bands are volatility-based and consist of an upper, lower, and middle (20-period simple moving average) band.
- Relative Strength Index (RSI): An oscillator that measures the speed and change of price movements.
Trading Rules:
- Identify the Stock or Forex pair: Choose a stock with a history of mean reversion behavior. Look for stocks that oscillate within a range around their 20-period simple moving average (SMA).
- Set Up the Bollinger Bands: Plot Bollinger Bands on the stock’s price chart. The standard setting for the bands is a 20-period SMA with two standard deviations for the upper and lower bands.
- Use RSI for Confirmation: Apply the RSI indicator to the same chart. Set the RSI period to 14. Look for the RSI to indicate overbought or oversold conditions.
- Identify Overextension: Enter a trade when the stock price touches or crosses the outer Bollinger Band (overextension condition) and the RSI indicates overbought (above 70) or oversold (below 30) conditions, depending on whether you’re looking for short or long trades.
- Take Profits and Manage Risk: Once in a trade, aim to take profits when the price starts moving back toward the middle Bollinger Band or the 20-period SMA. Place a stop-loss order to limit potential losses if the price continues moving against your trade.
- Trade Sizing: Determine your position size based on your risk tolerance and the distance to your stop-loss level.
Example:
You’re monitoring Stock XYZ, which typically oscillates around its 20-period SMA. You notice that the stock has recently touched the upper Bollinger Band, and the RSI is above 70, indicating overbought conditions. You enter a short trade at that point, expecting the price to revert to the mean.
You set a profit target at the 20-period SMA and place a stop-loss order just above the recent high. If the trade goes as expected, you take profits when the price reaches the SMA. If it doesn’t and the price rises, your stop-loss order limits your potential losses.
This is a simplified example, and actual trading involves careful analysis, risk management, and adapting to changing market conditions. Mean reversion strategies can be applied to various time frames and asset classes. Still, it’s crucial to thoroughly backtest and refine the strategy before implementing it in a live trading environment.
To read all detailed trading rules, please visit our mean reversion strategy and get indicators and strategy guide.


