Table of Contents
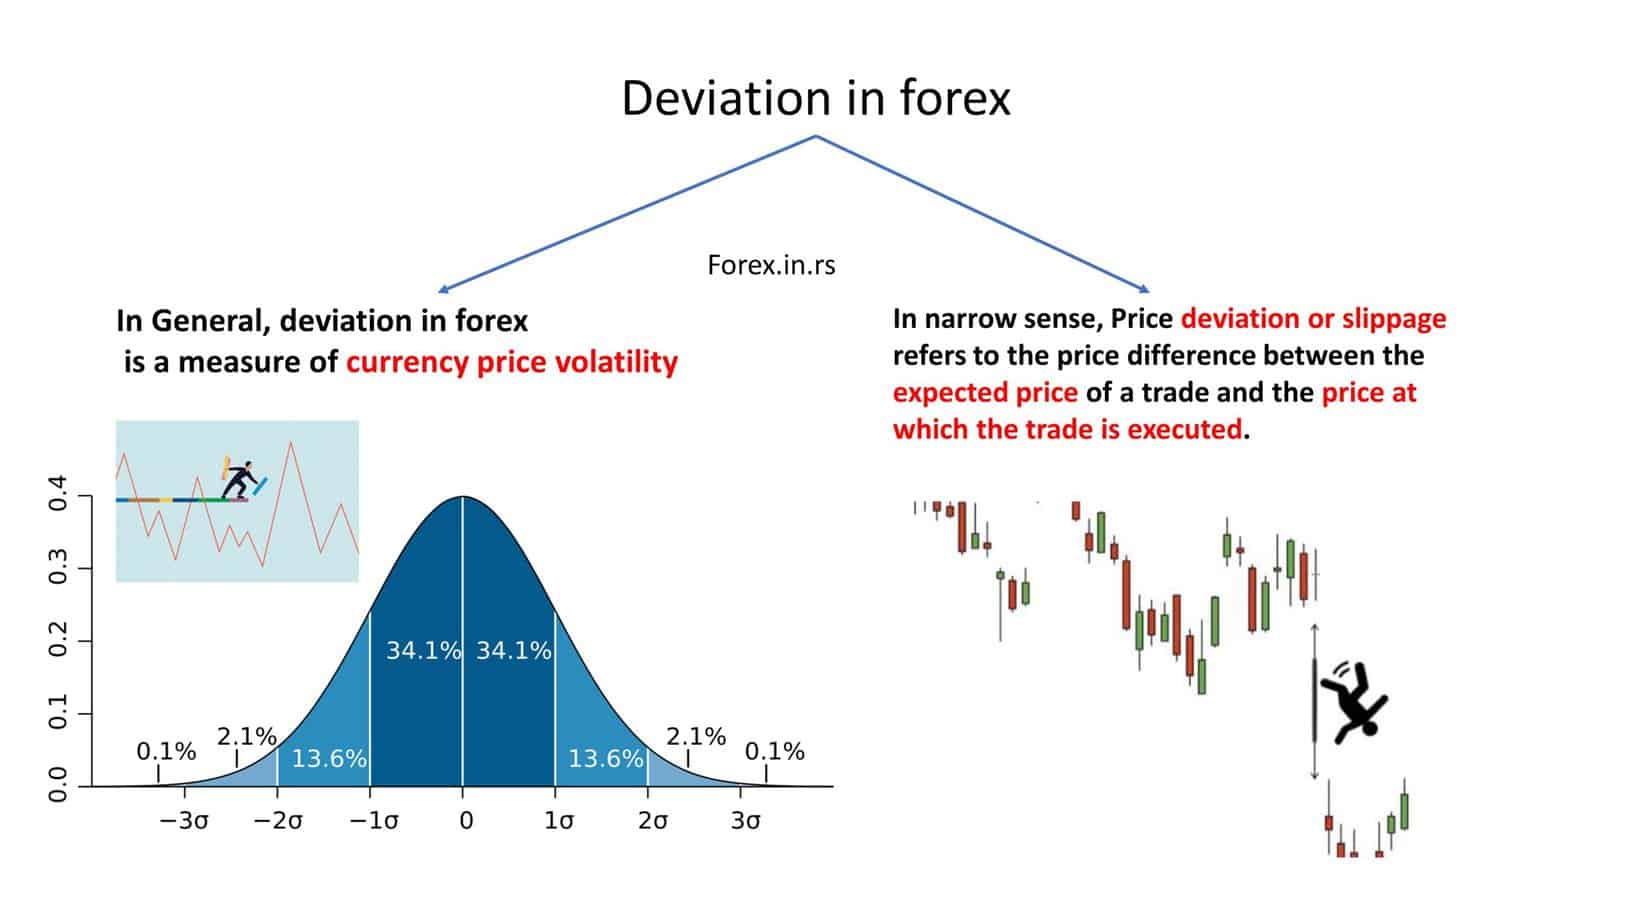
This article will explain two meanings of deviation in Forex: general and narrow.
This article will analyze trading moments when the executed price is not the same as the expected execution price when we have a price deviation in MT4 or MT5. This can mean you get an unfair execution for your trade without knowing what happened to the original price. Forex deviation means we can define it in two ways: generally, we are talking about standard deviation in Forex.
By mistake, some people, in a narrow way, use the expression deviation when they explain slippage.
What is the deviation in Forex?
Generally, the deviation in Forex measures currency price volatility and market activity. Standard deviation measures how widely price values are dispersed from the mean or average. High deviation means closing prices are falling far from an established price mean. Low deviation means that closing prices are falling near a selected price mean.
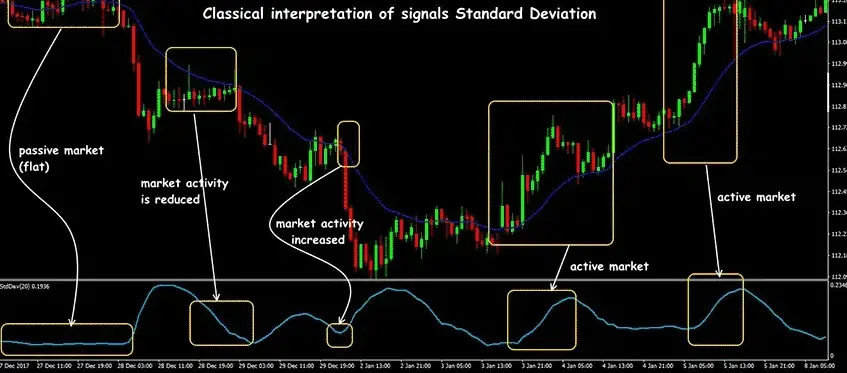
We can explain standard deviation as a market activity because market activity usually increases too when standard deviation increases.

However, traders often use the term deviation when pointing out existing slippage.
In the narrow sense, price deviation or slippage refers to the price difference between the expected price of a trade and the price at which the trade is executed. For example, slippage is a standard error that occurs during the volatility market and wide spreads, and trades are filled at a price different from the requested price.
Futures and Forex are different financial instruments, but their trading methods are similar. Standard deviation is a popular technique used in forex trading. Experienced individuals know that sudden volatility can close out profitable future trades as losses. This is where the standard deviation comes in. It helps to establish the currency pair’s volatility before placing the order. The deviation is derived from statistics to understand a data set’s variance from the mean value. The higher the value from its mean, the greater its standard deviation.
In Forex, the deviation is used to measure volatility. Traders use deviation to contextualize the current action price by determining a periodic price’s closing relation to a mean or average value. This deviation is also known as slippage. In simple terms, slippage refers to the market’s movement between the order’s playing time and the fulfillment time.
Please always check the deviation for the quoted price, “off quotes” MT4 error.
Slippage example:
A broker quotes EURUSD as follows:
Bid 1.3000
Ask 1.3001
Upon receiving the quote above in his terminal, the trader enters the order to purchase at 1.3001. Then, the order is sent to a broker across a network. When the broker receives the order, he must check whether the client’s latest order can be covered with sufficient funds. This means inspecting the client’s free margins after determining all other open positions. A delay is created from the transfer of communication to data transfer. The live price can change from when the broker receives the original quote to when he can fill the order. If our trade is executed at 1.3002, we have one pip slippage. The difference between the fill and the quoted price is called slippage.
Standard Deviation calculation in Forex (Example)
Let’s explain the concept of standard deviation for the EUR/USD currency pair prices using plain text without special symbols.
Week 1 (Low Volatility):
Daily Closing Prices (EUR/USD):
- Monday: 1.1000
- Tuesday: 1.1005
- Wednesday: 1.1003
- Thursday: 1.1007
- Friday: 1.1002
- Calculate the Mean (Average) Price: Add all the prices together and divide by the number of prices. Mean equals (1.1000 + 1.1005 + 1.1003 + 1.1007 + 1.1002) divided by 5 equals 1.10034.
- Calculate Each Price’s Deviation from the Mean: Subtract the mean from each price.
- Monday: 1.1000 minus 1.10034 equals -0.00034
- Tuesday: 1.1005 minus 1.10034 equals 0.00016
- Wednesday: 1.1003 minus 1.10034 equals -0.00004
- Thursday: 1.1007 minus 1.10034 equals 0.00036
- Friday: 1.1002 minus 1.10034 equals -0.00014
- Square Each Deviation: Multiply each deviation by itself.
- Monday: -0.00034 times -0.00034 equals 0.0000001156
- Tuesday: 0.00016 times 0.00016 equals 0.0000000256
- Wednesday: -0.00004 times -0.00004 equals 0.0000000016
- Thursday: 0.00036 times 0.00036 equals 0.0000001296
- Friday: -0.00014 times -0.00014 equals 0.0000000196
- Calculate the Variance: Add all the squared deviations together and divide by the number of prices. Variance equals (0.0000001156 + 0.0000000256 + 0.0000000016 + 0.0000001296 + 0.0000000196) divided by 5, which equals 0.0000000584.
- Calculate the Standard Deviation: Take the square root of the variance. The standard deviation equals the square root of 0.0000000584, which is approximately 0.00024.
Week 2 (High Volatility):
Daily Closing Prices (EUR/USD):
- Monday: 1.1000
- Tuesday: 1.1100
- Wednesday: 1.0900
- Thursday: 1.1150
- Friday: 1.0950
- Calculate the Mean (Average) Price: Add all the prices together and divide by the number of prices. The mean equals (1.1000 + 1.1100 + 1.0900 + 1.1150 + 1.0950) divided by 5, which equals 1.1020.
- Calculate Each Price’s Deviation from the Mean: Subtract the mean from each price.
- Monday: 1.1000 minus 1.1020 equals -0.0020
- Tuesday: 1.1100 minus 1.1020 equals 0.0080
- Wednesday: 1.0900 minus 1.1020 equals -0.0120
- Thursday: 1.1150 minus 1.1020 equals 0.0130
- Friday: 1.0950 minus 1.1020 equals -0.0070
- Square Each Deviation: Multiply each deviation by itself.
- Monday: -0.0020 times -0.0020 equals 0.000004
- Tuesday: 0.0080 times 0.0080 equals 0.000064
- Wednesday: -0.0120 times -0.0120 equals 0.000144
- Thursday: 0.0130 times 0.0130 equals 0.000169
- Friday: -0.0070 times -0.0070 equals 0.000049
- Calculate the Variance: Add all the squared deviations together and divide by the number of prices. Variance equals (0.000004 + 0.000064 + 0.000144 + 0.000169 + 0.000049) divided by 5, which equals 0.000086.
- Calculate the Standard Deviation: Take the square root of the variance. The standard deviation equals the square root of 0.000086, approximately 0.00927.
Interpretation:
- Week 1 (Low Volatility): The standard deviation is 0.00024, indicating that the prices are very close to the mean and show low volatility. The EUR/USD prices have been relatively stable this week.
- Week 2 (High Volatility): The standard deviation is 0.00927, indicating a wide dispersion of prices from the mean, showing high volatility. The EUR/USD prices fluctuated significantly this week.
Dealing with slippage
There are ways present to deal with slippage. When individuals enter an order for market execution, they commit to buying/selling at the market’s current level. This means that their order will get fulfilled regardless of the slippage amount that can take place. Sometimes, brokers can allow to set up a limit for slippage when an order is placed. This is called the maximum deviation or point limit from the quoted price. However, a problem arises when many orders are not executed because they will be outside the limit for slippage. Brokers can also send re-quotes where they send the new price of the market when it has moved. Traders can choose whether they want to go forward with the new price.
What does deviation mean in Metatrader?
Deviation in Metatrader measures market volatility, which is how widely price values are dispersed from the mean or average. Metatrader calculates the deviation using a standard deviation with a default period of 20. If the indicator is high, the market is volatile.
As we can see in the chart below, the standard deviation on the MetaTrader chart can explain the market activity. If the market activity grows, the standard deviation line will grow, too, and the market will be active. On the contrary, when the standard deviation line decreases, market activity decreases, too. During Asian sessions, we usually see a flat EURUSD standard deviation because the market has moderate or low activity.

What does deviation mean in MT4?
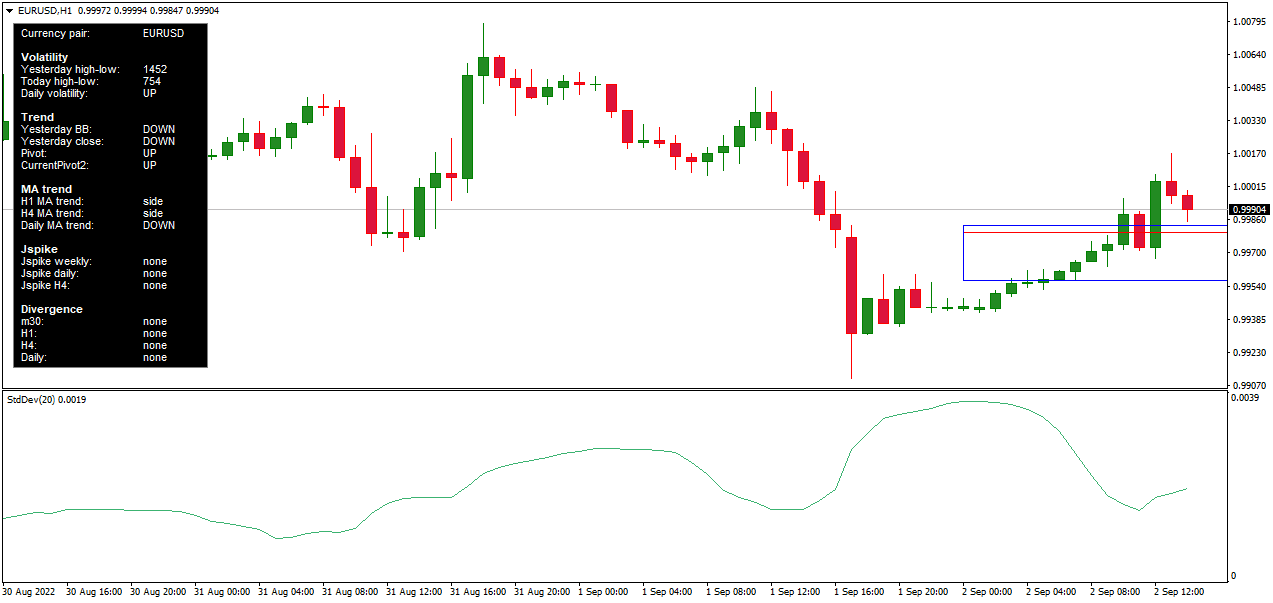
In MT4, the deviation is presented as price volatility measurement using the MT4 Standard deviation indicator. This indicator is an oscillator that measures how much price is dispersed from the mean or average. The zero value presents no volatility.
Please standard deviation indicator forex MT4
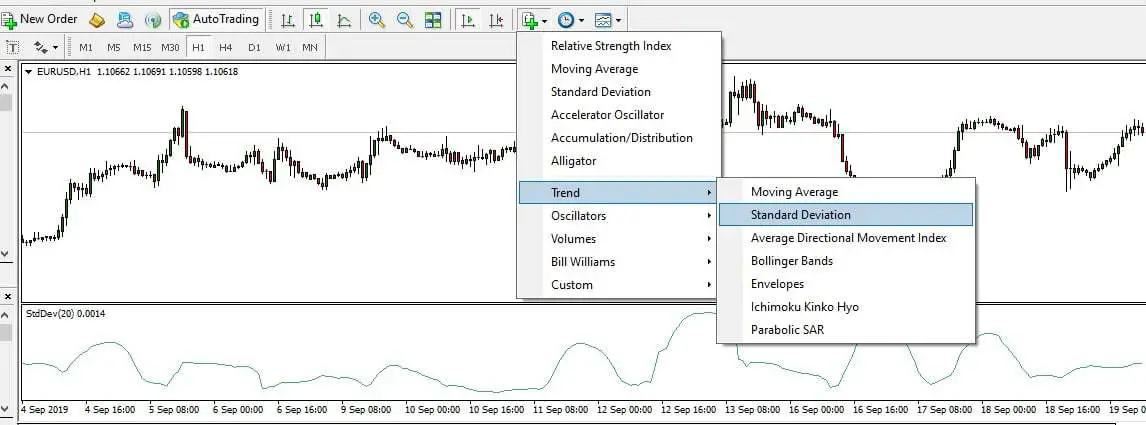
Below is an MT4 chart presented. To add a standard deviation indicator to the chart, go to” Indicators,” then “Trend,” and finally choose “Standard Deviation.”

What is a deviation in MT5?
In MT5, the deviation is presented as a price volatility measurement. The MT5 Standard deviation indicator measures the size of an asset’s recent price moves. The higher the value of the indicator, the wider the spread.
MT5 platforms are multi-asset trading platforms that cover noncentralized and centralized markets, including futures, stocks, and even trading instruments related to Forex, like Forex robots. MetaTrader is one trading software that traders use as their Forex platform. If a price slippage occurs in a trading platform, it may be called a DEVIATION IN METATRADER. Common types of MetaTrader platforms are MT4 and MT5. The trader may use options on the software to set the deviation in the slippage by themselves. These platforms incorporate tools and techniques used in the Forex and controls for setting parameters.

As with MT4, deviation in MT5 can be present. During high volatility, we can see a few pips of slippage, the difference between the expected price of a trade and the price at which the trade is executed. Even though many articles were written about the advantages of the MT5 platforms in terms of low slippage, our experience didn’t show any difference when we compared MT4 and MT5 slippage.
Traders commonly use MT5 due to the flexibility of financial instruments and the presence of Forex robots. Users of the MT5 platform can limit the maximum slippage amount in their accounts by setting and choosing the maximum deviation. The total deviation limit can also be arranged for pending orders, market orders, and orders executed by the signal providers present in the MQL5 community. When the trader sets the maximum deviation amount, their orders will not run when slippage exceeds the amount charged.
Deviation and brokers’ fraud
Slippage matters because the trader can end up receiving unfair execution prices. The broker can profit with the trader’s money, which is also risk-free. If the broker handles orders differently following the market moving in favor of the trader or against him, it can be called asymmetric slippage. This is an illegal practice and is termed fraud.
Checking for slippages should always be done on life, not on a demo account. The average of all slippages should be calculated over several trade orders. The number of negative and positive slippages should be the same if there are arbitrary movements. If the number of negatives increases, there is an excellent chance that something is incorrect. Although testing for slippage costs some money, it might be an investment for future higher-priced orders.
Conclusion
In forex trading, standard deviation measures how much the currency prices vary from their average price. A higher standard deviation indicates more price fluctuation and higher market activity, which implies higher volatility. Conversely, a lower standard deviation indicates that prices are more stable, suggesting lower market activity and volatility. Understanding this helps traders make informed decisions about their trades based on the level of risk they are willing to take.


