Table of Contents
To explain the Doji candlestick pattern strategy in detail, let’s break it down into key elements:
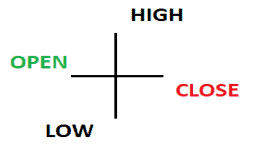
Understanding the Doji Candle
- Formation: A Doji forms when the open and close prices are nearly identical, showing market indecision.
- Indecision Signal: Neither buyers nor sellers dominated during that period. The candle has a small or non-existent body with wicks extending on both ends.
- Emotional Battle: The market tried to push higher and lower but ultimately closed where it started.


Key Trading Strategy with Doji Candles
-
Volume Analysis:
- If the Doji appears after a period of decreasing volume, this often signals that the market is building momentum for a potential breakout.
- A subsequent high-volume breakout confirms the direction.
-
Support and Resistance Levels:
- A Doji forming above a resistance level can indicate a bullish continuation if the next candle breaks higher.
- A Doji forming below a support level can indicate a bearish continuation if the next candle breaks lower.
- Always wait for confirmation from the next candle before taking action.
-
Breakout Confirmation:
- If price breaks above Doji’s high with strong volume, it’s a bullish signal.
- If price breaks below Doji’s low with strong volume, it’s a bearish signal.
Strategy for Trading the Doji
-
Identify Key Levels:
-
Look for a Doji forming near significant support or resistance zones.
-
-
Volume Check:
-
If the Doji appears on low volume, pay attention to the next candle for confirmation.
-
-
Confirmation Candle:
-
Break Above Resistance + High Volume ? Go Long
-
Break Below Support + High Volume ? Go Short
-
-
Avoid Assumptions:
-
A Doji doesn’t always signal reversal; sometimes it marks continuation after consolidation.
-
Example Scenario
-
Stock in an Uptrend ? Hits resistance ? Doji forms on low volume ? Next candle breaks resistance on high volume ? Go Long.
-
Stock in a Downtrend ? Hits support ? Doji forms on low volume ? Next candle breaks support on high volume ? Go Short.
Common Mistakes to Avoid
- Assuming a Doji always signals reversal: A Doji can indicate both reversal or continuation. The key is to wait for the next candle to confirm the move.
- Ignoring Volume: Low-volume breakouts can be false signals.
Timeframe Considerations
- Lower Timeframes (e.g., 1-minute, 5-minute): Expect faster moves with more noise from short-term traders.
- Higher Timeframes (e.g., Daily, Weekly): Patterns are more reliable as they reflect institutional activity.
Example Scenario
- An asset trending upward and breaks above a known resistance level.
- After breaking resistance, a Doji forms — signaling hesitation or indecision.
- The next candle appears to dip lower but quickly reverses, breaking higher and increasing volume.
- This breakout confirms the bullish continuation, making it a solid entry opportunity.
Detailed Explanation of the Doji Breakout Strategy in an Uptrend
In this scenario, we’ll walk through a step-by-step analysis of how a Doji candle can act as a pivotal signal for identifying a bullish continuation after breaking resistance.


Step 1: Identifying the Uptrend
- Trend Analysis: The asset should be in a clear upward trend, characterized by higher highs and higher lows.
- Momentum Indicators: Tools like the moving average, trendlines, or volume profile can help confirm the strength of the uptrend.
Key Sign: The price approaches a known resistance level — a zone where price has previously struggled to move higher.
Step 2: Breakout Above Resistance
- The asset’s price successfully breaks above resistance, which is often seen as a bullish signal.
- A strong breakout should ideally occur with increased volume, confirming stronger buying pressure.
?? Key Sign: The breakout candle closes above the resistance level with notable bullish momentum.
Step 3: Formation of the Doji Candle
- After the breakout, a Doji candle appears. This Doji forms when:
- The open and close prices are nearly identical.
- The candle shows wicks on both ends, signaling that price attempted to move higher and lower but ultimately closed at a similar point to its opening.
Why Does This Matter?
- The Doji reflects indecision in the market. Traders are unsure whether the breakout will continue or fail.
- A Doji forming above resistance shows hesitation — some traders may be taking profits, while others await confirmation for further upside.
Key Sign: The Doji itself is not a trade signal — it’s a warning to watch what happens next.

Step 4: The Dip and Reversal
- The candle following the Doji appears to dip below the Doji’s low, creating the illusion of a bearish reversal.
- However, this brief dip is often a liquidity grab — a technique where smart money pushes price down to trigger stop losses and attract sellers before reversing sharply.
Key Sign: The reversal happens swiftly, with the candle closing above both the Doji’s high and the resistance zone.
Step 5: Breakout Confirmation
- The next candle surges upward with increased volume, confirming bullish strength.
- This increase in volume is crucial — it shows new buyers are stepping in, validating the continuation.
Entry Signal: A confirmed breakout above the Doji’s high with increased volume is a strong long entry opportunity.
Step 6: Entry and Risk Management
- Entry: Enter the trade once the confirmation candle closes above the Doji’s high.
- Stop Loss: Place a stop loss just below the Doji’s low or previous resistance zone for protection.
- Take Profit Targets: Aim for:
- A measured move (the distance from the previous swing low to the resistance breakout).
- Key resistance zones further up the chart.
Example Scenario
Imagine Gold (XAU/USD) is trending upward:
- The price approaches a key resistance at $2,000 and eventually breaks above it on strong momentum.
- After the breakout, a Doji forms at $2,010, signaling indecision.
- The next candle dips to $2,005 but quickly reverses and closes strong at $2,020 with higher volume.
- This reversal candle signals bullish continuation — a solid entry opportunity.
Entry Point: $2,020 (after the confirmation candle closes).
Stop Loss: $2,005 (below the Doji’s low).
Target: $2,050 (based on previous resistance or a measured move).
Key Psychological Factors
- The Doji acts as a psychological pause where buyers and sellers balance out — a potential trap for traders who expect immediate continuation.
- The brief dip following the Doji often tricks retail traders into believing a reversal is occurring, only for the price to surge higher.
Final Tip
This strategy works best when combined with:
- Volume confirmation
- Support/resistance levels
- Trend analysis
By waiting for the confirmation candle after the Doji, you reduce the risk of false breakouts and improve your chances of catching powerful bullish moves.
Final Tip
Combining the Doji pattern with support/resistance, volume analysis, and confirmation candles enhances the strategy’s reliability. Avoid trading a Doji in isolation; instead, focus on the market context for the best results.

He is an expert in financial niche, long-term trading, and weekly technical levels.
The primary field of Igor's research is the application of machine learning in algorithmic trading.
Education: Computer Engineering and Ph.D. in machine learning.
Igor regularly publishes trading-related videos on the Fxigor Youtube channel.
To contact Igor write on:
igor@forex.in.rs
Related posts:
- Doji Candlestick Patterns
- Double Doji Candlestick Pattern!
- Fibonacci Retracement Trading Strategy! – Golden Ratio Strategy!
- Trading Strategy for GBP/USD Based on GDP Reports – Boom Crash strategy
- VIX and Stochastic RSI Strategy – Volatility-Based Trading Strategy!
- Engulfing Pattern Trading Strategy!
- The Best 4h Trading Strategy
- What is ADX indicator? – ADX Trading Strategy
- The Best Divergence Trading Strategy
- Jim Simons Trading Strategy
- My PMI Report Trading Strategy!
- Fair Value Gap Forex Trading Strategy
