Table of Contents
Alright, let’s break this down like we’re chatting over coffee. The latest CPI and PPI numbers from February 2025 came out, and they’re not exactly great news for the U.S. dollar. CPI, which tracks what we pay for groceries and rent, rose 2.8% over the past year. PPI, which looks at what producers are charging, climbed 3.2% over the same period. Both are above the Fed’s 2% sweet spot, meaning inflation still hangs around, eating away at the dollar’s buying power. When prices rise like this, each dollar buys less, and that’s bad for its value—think of it like your money slowly losing muscle. Plus, with PPI outpacing CPI, it’s a hint that businesses might pass on even higher costs soon, putting more pressure on the dollar down the road.
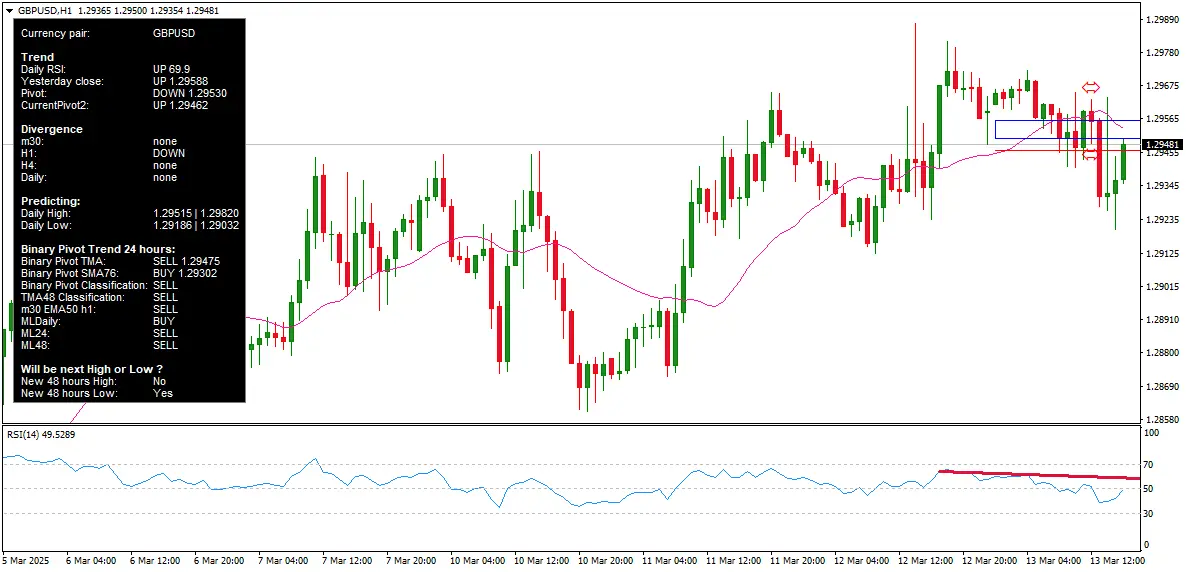
You’d expect this kind of news to shake things up in the currency markets. Higher inflation usually makes people nervous about a currency, and traders might dump the dollar for something like the euro or the British pound. That should push pairs like EURUSD (euro vs. dollar) and GBPUSD (pound vs. dollar) higher, maybe even to new highs. But here’s the weird part—they barely budged. As of today, March 13, 2025, EURUSD is hovering around 1.05-1.06, and GBPUSD is stuck near 1.29-1.30. No big jumps, no new peaks, just kind of… meh.
So, why the snooze fest? The markets are shrugging and saying, “Yeah, we saw this coming.” The 2.8% CPI and 3.2% PPI weren’t huge surprises—analysts were expecting something close, maybe 2.9% for CPI and a bit more for PPI. Since the numbers didn’t scream “crisis,” traders didn’t panic. Plus, the monthly PPI was flat at 0.0%, which might’ve calmed some nerves, suggesting things aren’t spiraling out of control yet. Another thing: the dollar’s still the world’s go-to currency, especially when global uncertainty—like trade tariffs or geopolitical stuff—kicks in. Even with inflation nibbling at it, people aren’t rushing to ditch it for euros or pounds.
Also, let’s be honest—other factors are at play. The euro has its headaches, with Europe’s economy not firing on all cylinders and the pound’s dealing with Brexit leftovers and a cautious Bank of England. So, even if the dollar looks wobbly, the euro and pound aren’t flexing either. That keeps EURUSD and GBPUSD in this tight little dance, not breaking out or hitting new highs.
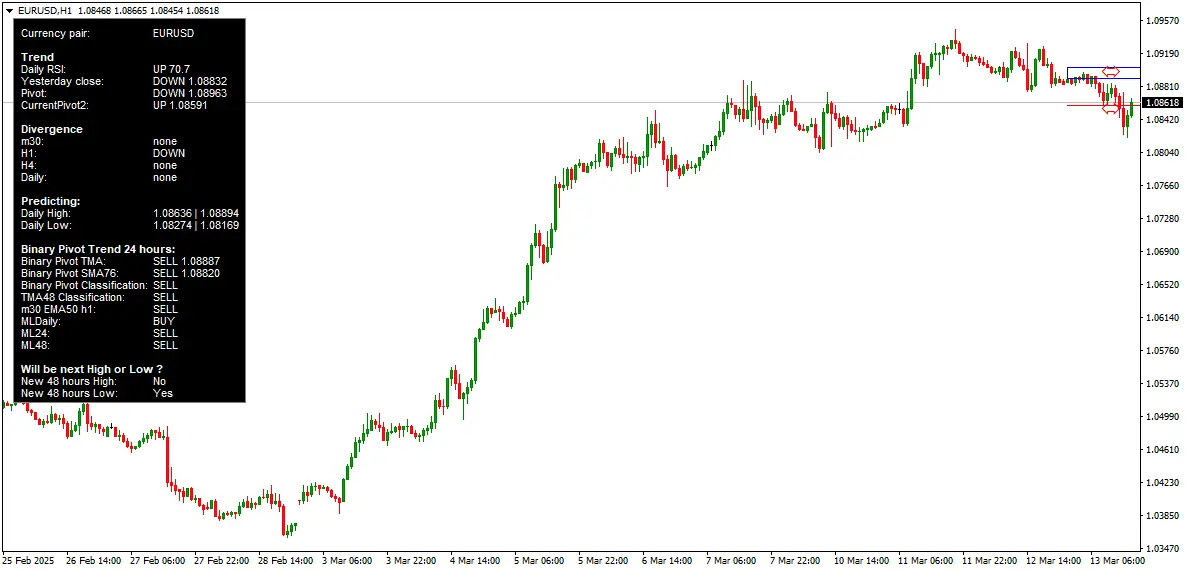
In short, the CPI and PPI data are flashing warning lights for the dollar—higher inflation’s not good news—but the markets are acting like they’ve already read the script. There are no wild swings, no new records for these currency pairs, just a lot of “eh, we’ll deal with it.” Everyone’s waiting for the next big plot twist before making a move.
As of March 13, 2025, here are the latest available Consumer Price Index (CPI) and Producer Price Index (PPI) statistics for the United States, based on the most recent data from the U.S. Bureau of Labor Statistics (BLS):
Latest CPI Statistics
-
February 2025 CPI (Released March 12, 2025):
-
Monthly Change: The Consumer Price Index for All Urban Consumers (CPI-U) rose by 0.2% in February, seasonally adjusted.
-
Annual Change: Over the 12 months ending in February 2025, the CPI-U increased by 2.8%, not seasonally adjusted.
-
Core CPI (excluding food and energy): Increased by 0.2% in February (seasonally adjusted) and 3.1% over the past year (not seasonally adjusted).
-
Key Drivers:
-
Shelter: Contributed significantly, rising due to ongoing housing demand and limited supply, though the pace has moderated.
-
Gasoline: Declined, providing some offset to upward pressures.
-
Food: Inflation eased slightly, contributing less to the overall increase.
-
-
-
Source Context: The CPI measures the average price change paid by urban consumers for a basket of goods and services, covering about 93% of the U.S. population. The February data reflects trends up to that month, with the next release scheduled for April 10, 2025.
Latest PPI Statistics
-
February 2025 PPI (Released March 13, 2025):
-
Monthly Change: The Producer Price Index for final demand was unchanged (0.0%) in February, seasonally adjusted.
-
Annual Change: Over the 12 months ending in February 2025, the PPI for final demand advanced by 3.2%, not seasonally adjusted.
-
Breakdown:
-
Final Demand Goods: Increased by 0.3%, driven by rising energy prices.
-
Final Demand Services: Declined by 0.2%, tempering the overall index.
-
-
Key Drivers:
-
Goods Prices: A 0.3% rise, particularly in energy, reflects volatility in commodity markets.
-
Services Prices: A decline suggests softening demand or cost pressures in service sectors.
-
-
-
Source Context: The PPI measures the average change in selling prices received by domestic producers for their output. It is often seen as a leading indicator of consumer price trends. The next PPI release is scheduled for April 11, 2025.
Why These Trends?
-
CPI (2.8% Annual Increase):
-
Shelter Costs: Housing remains a significant driver due to persistent supply shortages and steady demand, though rent increases have slowed compared to prior years.
-
Energy Prices: Gasoline declines reflect seasonal patterns and global oil market dynamics, counteracting some inflationary pressures.
-
Food Inflation: Easing slightly due to improved supply chains and lower commodity prices, though still above pre-pandemic levels.
-
Broader Context: Inflation has moderated from its 2022 peak (around 9%) but remains above the Federal Reserve’s 2% target, indicating a cooling yet sticky inflationary environment.
-
-
PPI (3.2% Annual Increase, 0.0% Monthly):
-
Goods vs. Services Divergence: The uptick in goods prices (e.g., energy) reflects producer-level cost pressures, possibly from supply chain fluctuations or geopolitical factors affecting oil. The drop in services prices could signal weaker demand or competitive pricing in sectors like transportation or trade services.
-
Leading Indicator Role: The PPI’s annual rise of 3.2% exceeds the CPI’s 2.8%, suggesting potential future pressure on consumer prices if producers pass costs along, though the flat monthly reading hints at stabilization.
-
Economic Conditions: A strong labor market (e.g., robust job growth in late 2024) and anticipated policy shifts (e.g., tariffs under a new administration) may keep producer prices elevated, though immediate monthly pressures appear contained.
-
Analysis and Outlook
-
CPI: The 2.8% year-over-year increase shows inflation cooling from its highs but persisting above the Fed’s target. Shelter costs remain the stickiest component, while energy provides relief. This suggests a gradual disinflation process with no immediate reacceleration.
-
PPI: The unchanged monthly reading alongside a 3.2% annual rise indicates a pause in producer price growth after steady increases since mid-2024. If the trend holds, this could bode well for future CPI moderation, though goods price volatility warrants monitoring.
These figures reflect economic conditions as of February 2025, influenced by a mix of supply-side factors (e.g., energy costs, housing supply) and demand-side pressures (e.g., consumer spending, labor market strength). Additional data releases would be needed for the most current insights beyond March 13, 2025.

Trader at Leanta Capital
Igor has been a trader since 2007. Currently, Igor works for several prop trading companies.
He is an expert in financial niche, long-term trading, and weekly technical levels.
The primary field of Igor's research is the application of machine learning in algorithmic trading.
Education: Computer Engineering and Ph.D. in machine learning.
Igor regularly publishes trading-related videos on the Fxigor Youtube channel.
To contact Igor write on:
igor@forex.in.rs
