Table of Contents
Today, we’ll explore the intricacies of two fundamental chart patterns: the double top and double bottom. These patterns are frequently observed on trading charts and can offer significant insights when correctly interpreted. However, many traders fall into the trap of trying to catch every instance of these patterns, often leading to costly mistakes. In this article, we’ll explore a strategic approach to effectively identifying and trading double tops and double bottoms.


Understanding the Double Bottom and Double Top Patterns
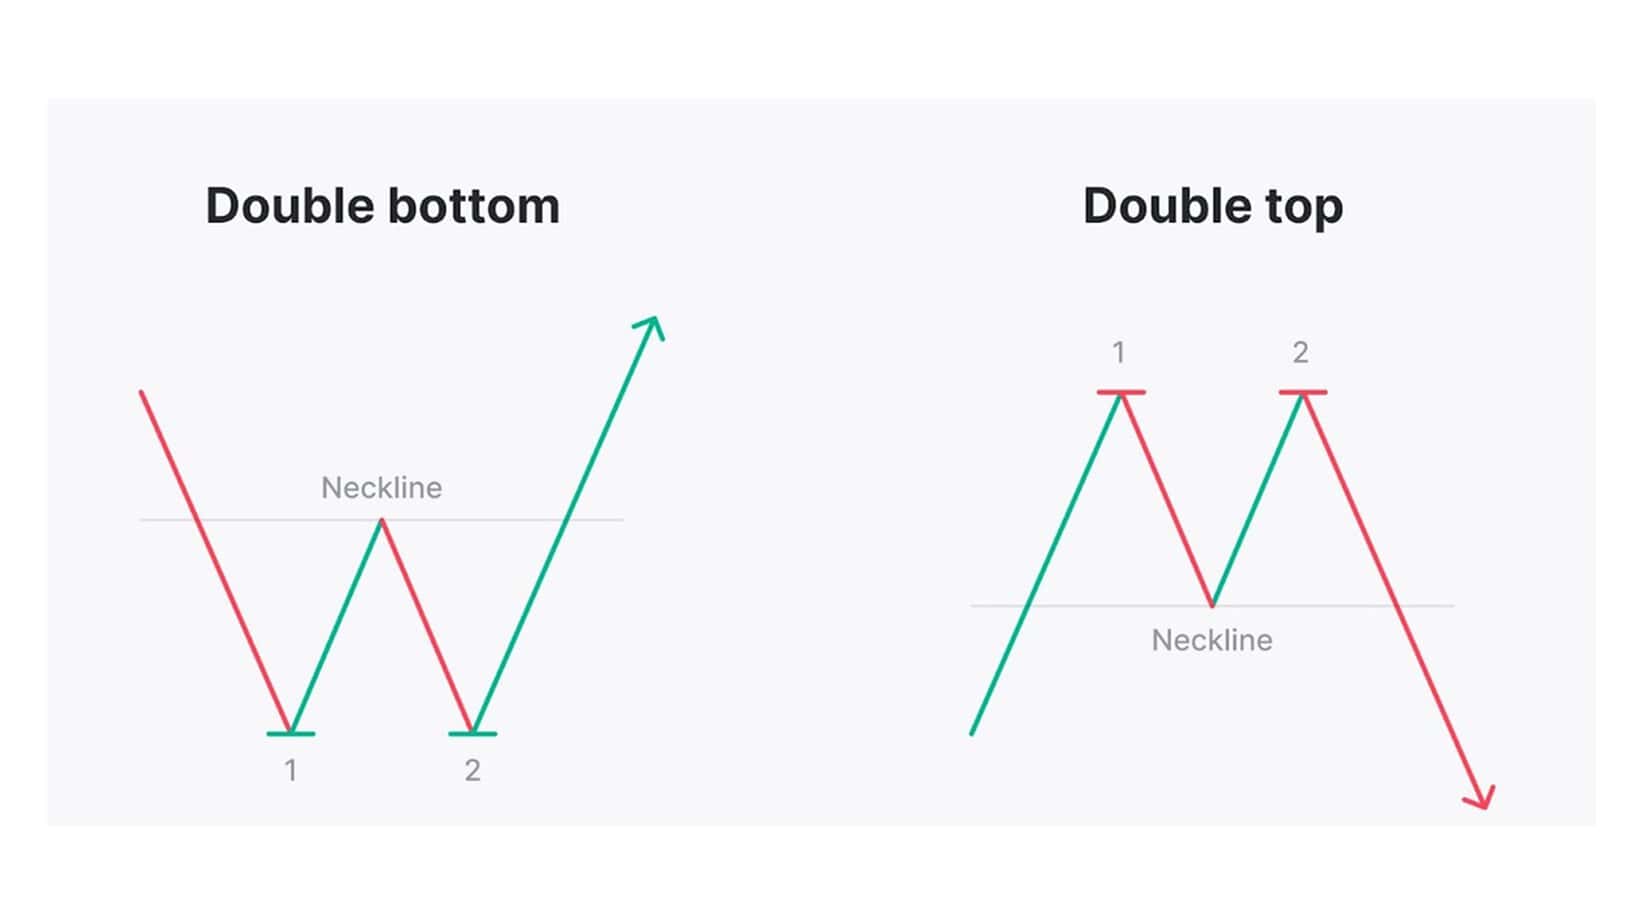
A double-bottom pattern signifies the potential reversal of a bearish trend into a bullish one. It occurs when the price makes two successive attempts to break a support level but fails, leading to a bullish reversal. The critical points in this pattern include the initial touch of the support level, a subsequent rally, a second touch of the support level, and a bullish breakout.


Please watch my video about this topic:
Double Bottom Pattern
Definition:
The Double Bottom pattern is a bullish reversal chart pattern that typically forms after a downtrend. It is characterized by two distinct lows at approximately the same price level, with a moderate peak or resistance level between them. This pattern suggests that the downward momentum is weakening, and a reversal to an upward trend is likely.

Formation:
- First Bottom: The price falls to a new low, indicating bearish sentiment.
- Peak: After hitting the first bottom, the price rises to a certain level, creating a peak or resistance.
- Second Bottom: The price declines again but finds support near the same level as the first bottom, signaling buyers are entering the market.
- Breakout: The pattern is confirmed when the price breaks above the resistance level (the peak between the two bottoms), often leading to a new uptrend.
Significance:
The Double Bottom pattern is a reliable indicator of a potential trend reversal. Traders often look for a significant increase in trading volume during the breakout to confirm the pattern’s validity.
Double Top Pattern
Definition:
The Double Top pattern is a bearish reversal chart pattern that generally forms after an uptrend. It is identified by two consecutive peaks at approximately the same price level, with a moderate trough or support level between them. This pattern indicates that upward momentum is fading, and a downward trend is likely to be reversed.
Formation:
- First Top: The price rises to a new high, showing bullish solid sentiment.
- Trough: After reaching the first top, the price declines to a certain level, forming a trough or support.
- Second Top: The price increases again but struggles to surpass the level of the first top, signaling that sellers are entering the market.
- Breakdown: The pattern is confirmed when the price falls below the support level (the trough between the two tops), often leading to a new downtrend.
Significance:
The Double Top pattern is a crucial indicator of a potential trend reversal. Traders often look for a significant increase in trading volume during the breakdown to validate the pattern and the likelihood of a sustained downtrend.
Conversely, a double-top pattern indicates a possible reversal from a bullish trend to a bearish one. This pattern forms when the price hits a resistance level twice, with a decline in between, signaling a potential bearish reversal. Traders typically look for the first touch of the resistance, followed by a pullback, a second touch, and then a bearish breakout.
These patterns may seem easy to spot on historical charts, but they can be elusive in real-time trading. The key challenge lies in distinguishing between genuine and false patterns, which we’ll address later in this article.
Key Considerations When Trading Double Top and Double Bottom Patterns
Incorporating additional technical and analysis tools to enhance your success rate with these patterns is crucial. Here are the essential steps:
- Look for Divergence: Before exploiting a double bottom or double top, check for a bullish or bearish divergence on your chosen indicator (e.g., RSI, MACD). For a double bottom, a bullish divergence suggests that the second bottom may be higher than the first, indicating a potential reversal. Similarly, a bearish divergence in a double-top pattern signals that the second top may be lower than the first, foreshadowing a bearish reversal.
- Identify Strong Price Levels: Double tops and bottoms are most reliable at significant price levels, such as daily, weekly, or monthly highs and lows. These levels often serve as strong support or resistance, making them more likely to trigger a reversal. Ensure that the price reacts to these levels before committing to a trade.
- Align with Fundamental Analysis: While not mandatory, aligning your trades with fundamental factors can significantly boost your success. For instance, if you’re trading a double bottom on a currency pair, you’re positive news favoring the currency; this is the ‘conviction to your bullish bias.
Analyzing Double Tops and Bottoms on Live Charts
Let’s examine some real chart examples to put them into practice.
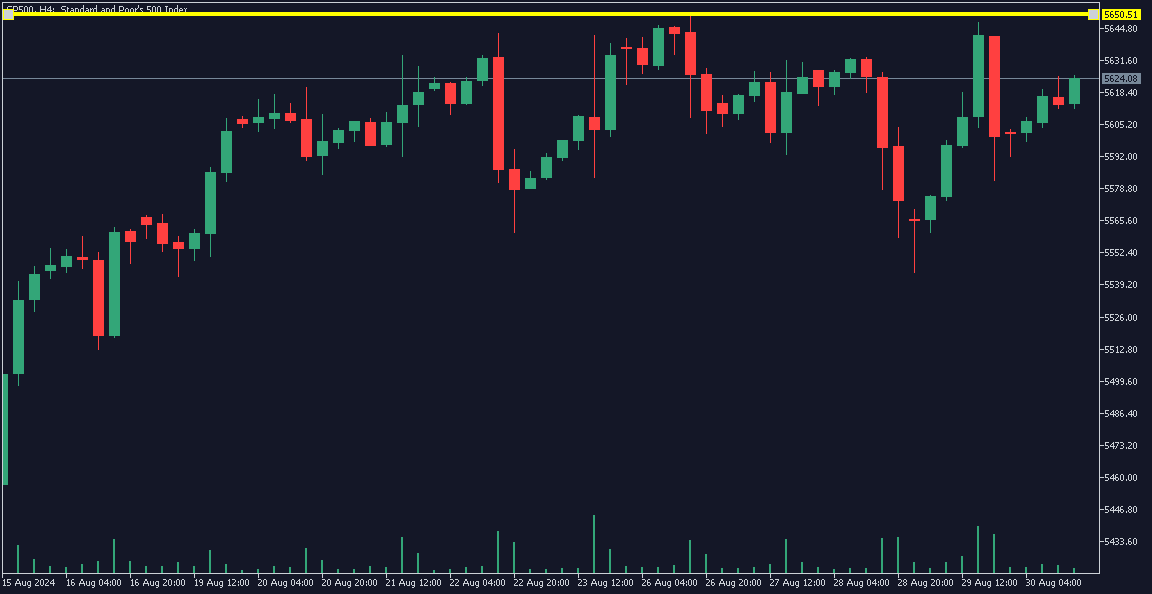
- Example 1: S&P 500 Index on a 4-Hour Timeframe: On the 4-hour chart, we observed a double-top pattern. However, this pattern could be misleading if viewed in isolation. By zooming out to the daily and weekly timeframes, we identified a solid bullish trend supported by fundamentals, including an anticipated interest rate cut by the Federal Reserve. Trading against such a strong trend, even with a double-top pattern, would be risky. This example underscores the importance of aligning your trades with the overall trend and fundamental context. So, selling trade, in my opinion, is not smart!!!
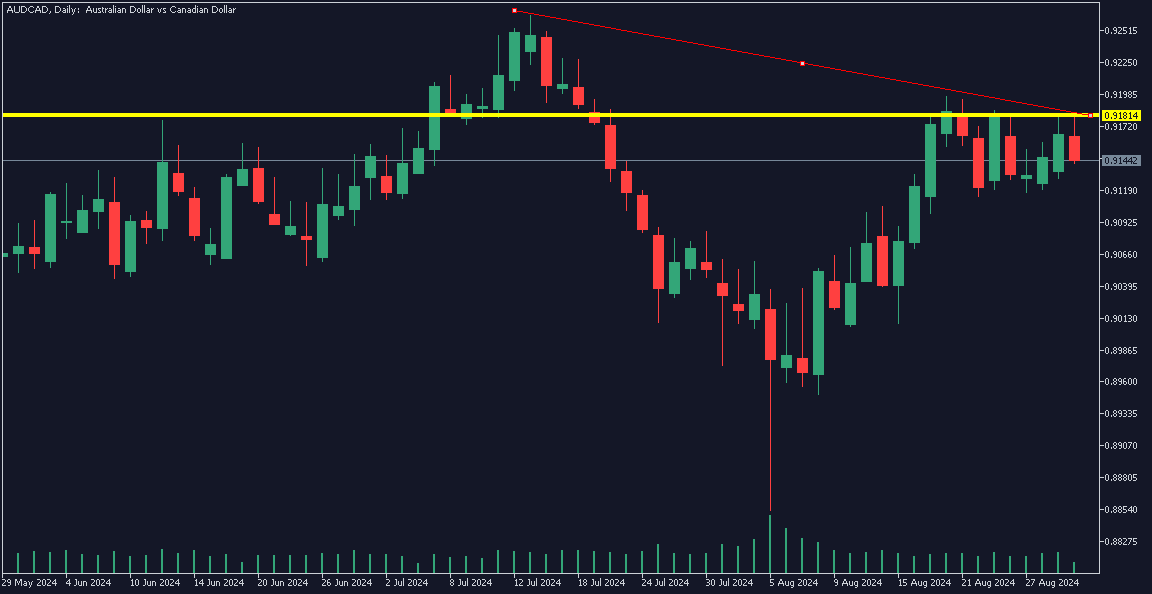
- Example 2: AUD/CAD Currency Pair: We spotted a double top pattern at a significant resistance level on the daily chart. Historical data revealed that this area had previously acted as a strong resistance, reinforcing the potential for a bearish move. By analyzing the broader trend and identifying bearish divergence on the RSI, we concluded that the pattern was valid, making it a good candidate for a short trade.
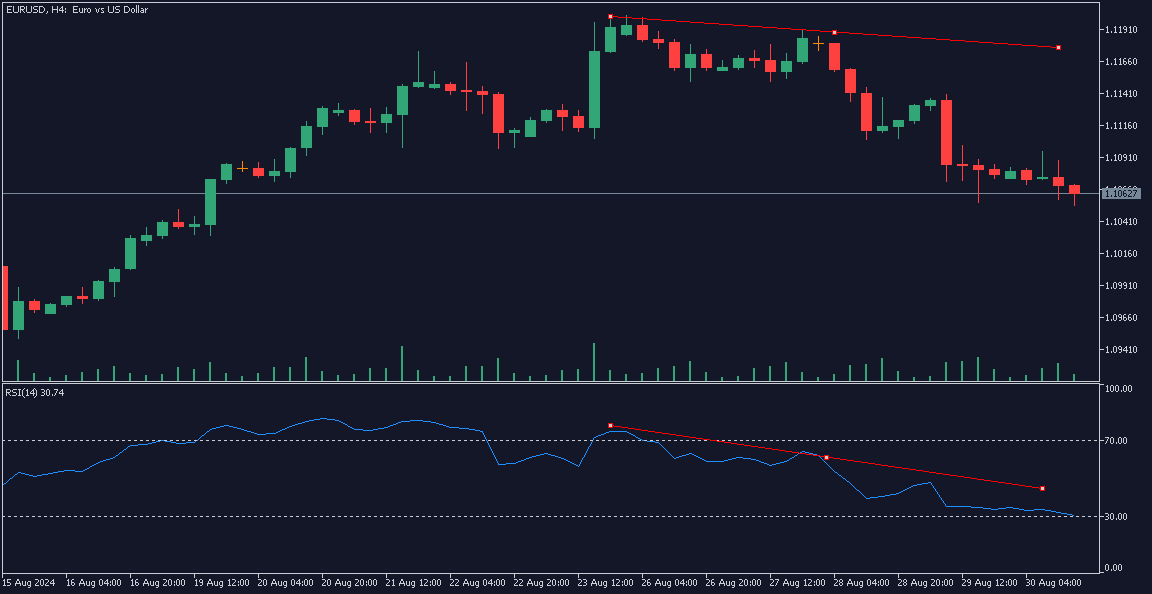
- Example 3: EUR/USD Currency Pair: The 4-hour chart presented a double-top pattern with a clear bearish divergence on the RSI. The daily and weekly charts further confirmed a bearish trend, enhancing the reliability of the setup. This comprehensive analysis allowed us to confidently short the pair, aiming to capitalize on the emerging downtrend.
Conclusion: The Art and Science of Trading Double Tops and Bottoms
Trading double-top and double-bottom patterns require technical analysis, fundamental insight, and market experience. Before moving, consider the broader context—daily, weekly, and monthly charts—along with key price levels and fundamental factors. This holistic approach will help you avoid false signals and increase your chances of success in trading these classic patterns.
Remember, trading is both an art and a science; mastering it takes time and practice. Stay patient, remain disciplined, and strive to improve your analysis skills.
I hope you found this guide helpful. Wishing you a great trading day, and as always, happy trading!

He is an expert in financial niche, long-term trading, and weekly technical levels.
The primary field of Igor's research is the application of machine learning in algorithmic trading.
Education: Computer Engineering and Ph.D. in machine learning.
Igor regularly publishes trading-related videos on the Fxigor Youtube channel.
To contact Igor write on:
igor@forex.in.rs
