Table of Contents
Today, we’re delving into a critical aspect of trading called Easy Market Trades. This concept involves identifying moments when various indicators and data align perfectly, presenting a clear and high-probability trading opportunity. We aim to break down what Easy Market Trades are and provide a real-time example using the British Pound (GBP) versus the US Dollar (USD).
The example is from May 30. 2024.


Watch the whole video from my FxIgor YouTube channel:


Understanding Easy Market Trades
Easy markets trades represent trades when multiple triggers are aligned in one direction. In that case, traders make a trading position if the 30-minute chart, daily chart, and fundamental data show the same direction. Using previous important price levels, the trader defines stop loss and target.
Easy Market Trades are trading scenarios where multiple signals converge, pointing toward a specific market direction. These signals include:

- 30-minute Chart: This short-term chart helps us identify immediate trends and price actions.
- Daily Chart: The daily chart offers a broader perspective, confirming the overall trend.
- Fundamental Data: Economic news and data releases that significantly impact market movements.
When these three elements align, they create a high-confidence trading setup, allowing us to make informed trading decisions.
Let us see what markets look like :
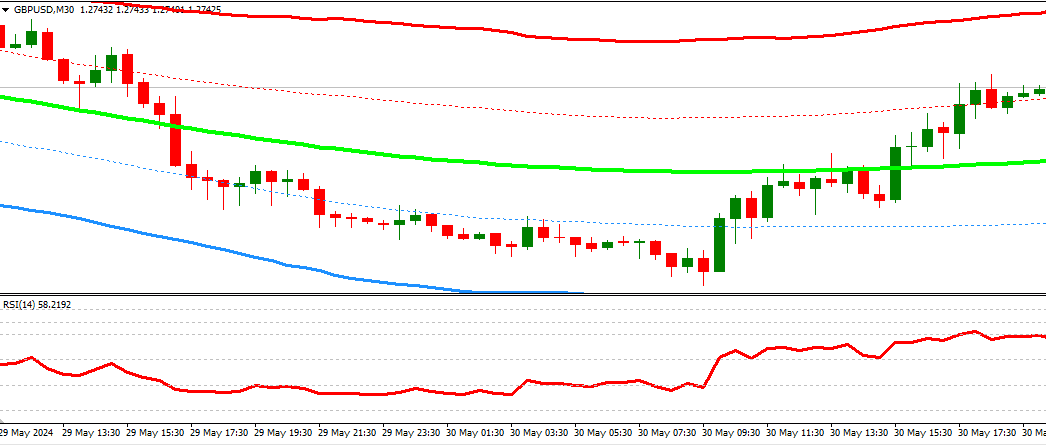
We can see a bullish trend 30 minutes above. Below is presented daily chart:
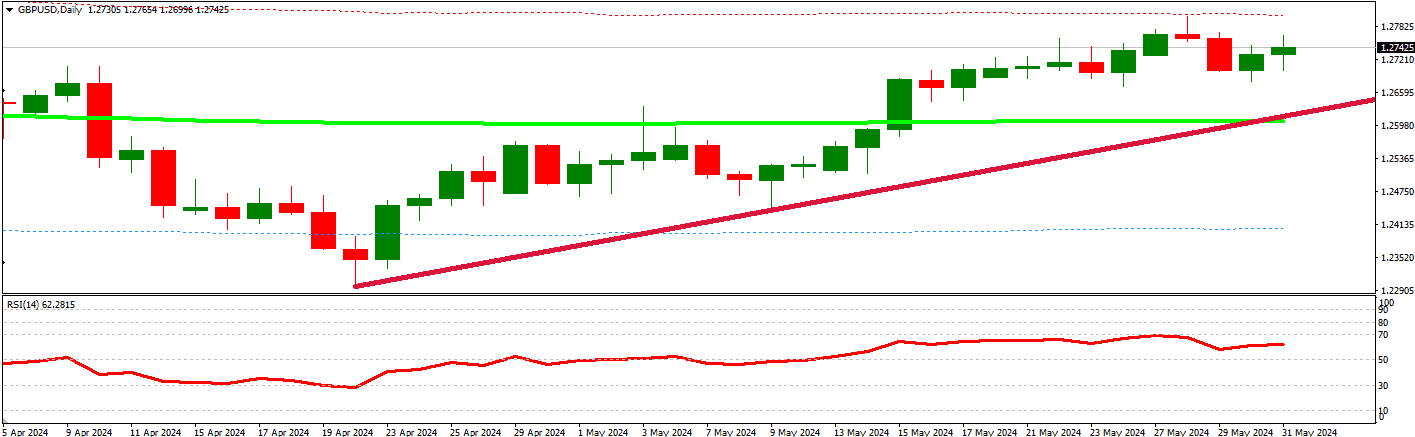
We can see a decrease in GDP value for GBPUSD. However, results are after the news little bit better than accepted, so the price is a little bit choppy but overall bullish:
Real-Time Example: GBP/USD Analysis
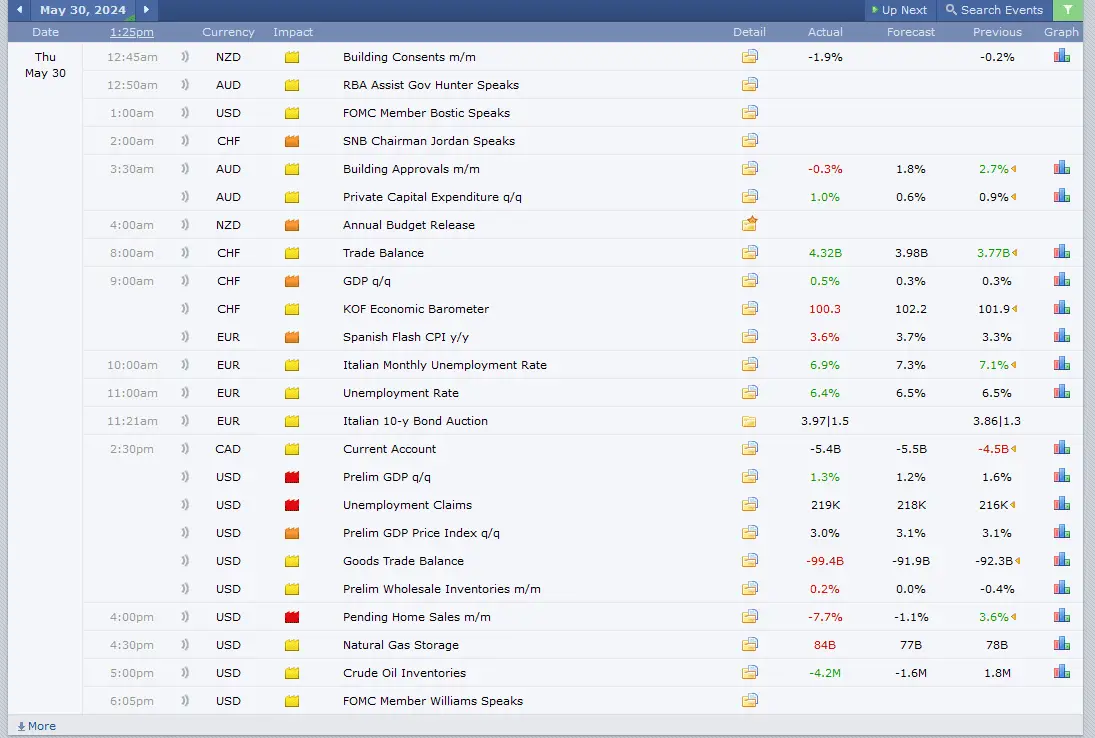
Let’s analyze the current market conditions for the British Pound versus the US Dollar. Recently, we’ve observed a notable market reversal. To understand the cause, we turn to fundamental data. By checking Forex Factory’s economic calendar, we note that today is a crucial day due to the release of GDP data for the US.
The Importance of Fundamental Data
Today’s GDP data release is critical because it provides insights into the health of the US economy. The expected GDP growth rate is 1.2%, a concerning figure for what was once the world’s leading economy. Over the past few weeks, the US Dollar has shown signs of weakness, which is likely to continue if the GDP data meets or falls below these low expectations.
Technical Analysis: Insights from the Charts
Daily Chart Insights
On the daily chart, the British Pound is exhibiting a bullish trend. This is confirmed by the upward movement in the Relative Strength Index (RSI). Drawing trend lines on the RSI helps us visualize this bullish sentiment more clearly.
30-Minute Chart Insights
Switching to the 30-minute chart, we notice a significant development: the bearish trend of the past two days has been broken. This break in the trend line on the RSI is a strong indicator of a potential market reversal.
The price started from the 1.27 price level in the EUR session and went up.
Formulating a Trading Strategy
Given the alignment of fundamental data and technical indicators, we have decided to enter a trade. Here’s our strategic plan:
Entry Point
We entered the trade expecting the price to reach 1.2730 before the GDP data was released. This entry point is based on the current bullish trend and the break in the bearish trend line on the 30-minute chart.
Risk Management
To manage our risk, we have set a stop loss of 15-20 pips below the entry-level. This stop loss ensures that we will still profit or break even, even if there is slippage due to market volatility during the GDP data release.
Target Levels
We have identified several key target levels based on historical data:
- 1.2730: Our short-term target before the GDP release.
- 1.2760: A recent resistance level that we are aiming to reach.
- 1.2850: A significant resistance level was observed multiple times over the past year.
These target levels provide a clear roadmap for managing our trade and locking profits at various stages.
The Power of Multiple Triggers
The essence of Easy Market Trades lies in the convergence of multiple triggers:
- Fundamental Data: Supports our trade direction.
- Daily Chart: Confirms the overall trend.
- 30-Minute Chart: Shows the breaking of short-term trends, indicating a reversal.
This alignment creates a high-probability trading opportunity, allowing us to trade confidently. However, remaining flexible and ready to adapt to changing market conditions is crucial.
Preparing for Different Scenarios
While we have a solid plan, we must also prepare for different scenarios. If the price oscillates or the GDP data surprises the market, stopping losses is vital to protect against significant losses. In such cases, we would place a stop loss just below the last hourly low to manage risk effectively.

He is an expert in financial niche, long-term trading, and weekly technical levels.
The primary field of Igor's research is the application of machine learning in algorithmic trading.
Education: Computer Engineering and Ph.D. in machine learning.
Igor regularly publishes trading-related videos on the Fxigor Youtube channel.
To contact Igor write on:
igor@forex.in.rs
