Table of Contents
The Fibonacci retracement tool is one of the most popular tools in technical analysis. It helps traders identify potential reversal levels and enhance their trading strategies. In MetaTrader platforms (MT4/MT5), this tool can be customized to suit individual trading needs and maximize performance. This article explores using and editing Fibonacci retracement levels in MetaTrader to achieve a better risk-reward setup.
Below, you can see my video:
What Is the Fibonacci Retracement Tool?
The Fibonacci retracement tool is a technical indicator used to identify potential support and resistance levels based on key Fibonacci ratios: 23.6%, 38.2%, 50%, 61.8%, and 100%. These levels are derived from the Fibonacci sequence and are believed to represent points where price movements may pause or reverse.
Traders use this tool to:
- Determine retracement levels within a trending market.
- Identify entry and exit points.
- Optimize stop-loss and take-profit placement.
Adding the Fibonacci Retracement Tool in MetaTrader
- Locate the Tool: In MetaTrader, select the Fibonacci retracement tool from the toolbar or the “Insert” menu under “Objects.”
- Draw the Tool: Click on a significant swing high and drag it to a swing low (or vice versa) to visualize the retracement levels.
Editing Fibonacci Levels in MetaTrader
To customize Fibonacci retracement levels and add additional levels, such as 88.6%, follow these steps:
- Access the Fibonacci Properties:
- Right-click on the Fibonacci retracement lines on your chart.
- Select “Object List.”
- Choose the Fibonacci retracement object and click “Edit.”
- Add or Modify Levels:
- You will see existing retracement levels in the “Fibo Levels” tab.
- To add a new level (e.g., 88.6%), click “Add.”
- Enter the desired percentage in the “Level” field (e.g.,
0.886for 88.6%). - In the “Description” field, label it (e.g., “88.6%”).
- Repeat this process to add 161.8% or 423.6% for extensions.
- Save the Changes:
- After adding or modifying levels, click “OK.”
- The new levels will appear on your chart using the Fibonacci retracement tool.
Importance of Additional Fibonacci Levels
While the commonly used levels (23.6%, 38.2%, 50%, 61.8%) provide valuable insights, incorporating less conventional levels like 88.6% can significantly improve trading accuracy. For instance, the 88.6% retracement level is often overlooked but serves as a critical reversal point in certain market conditions.
Example:
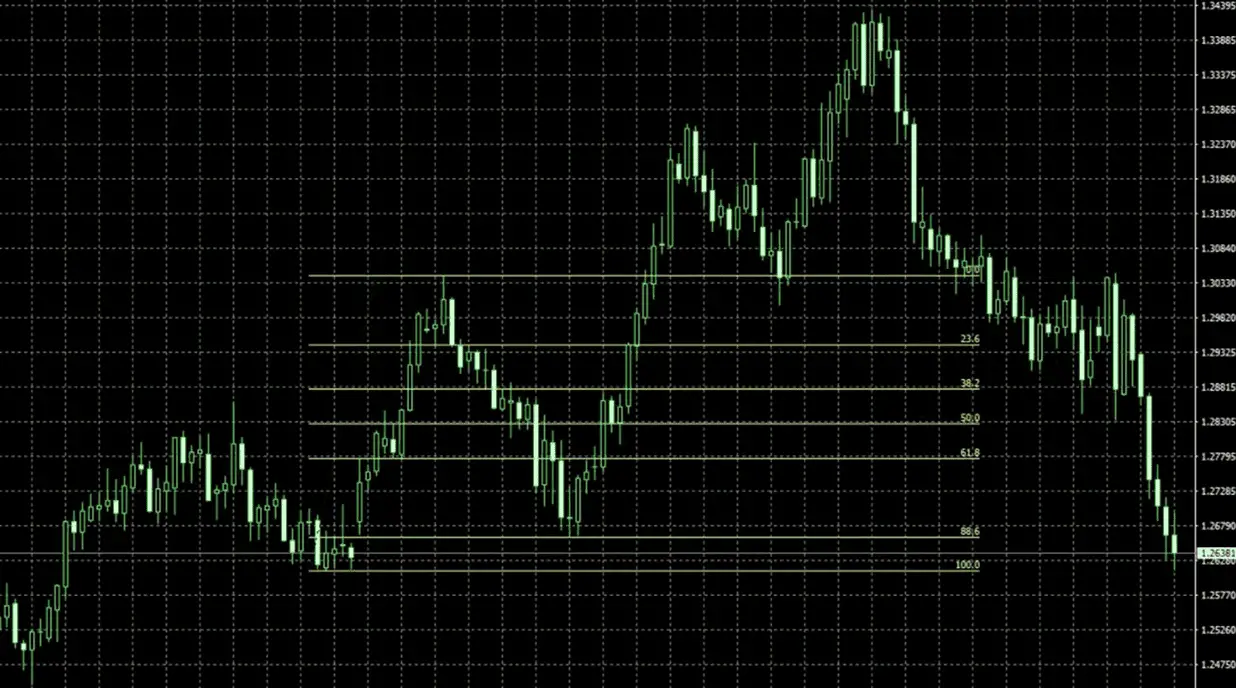
Imagine analyzing GBP/USD on a daily chart:
- The price makes a solid upward move but starts to retrace.
- Applying the Fibonacci retracement tool reveals the usual levels.
- Adding the 88.6% level shows that the price reacts precisely at this point, reversing and continuing its trend upward.

This subtle level can provide excellent entry opportunities with a tight stop-loss, enhancing the risk-reward ratio.
Optimizing Risk-Reward with Fibonacci
The Fibonacci tool is particularly effective for improving the risk-reward ratio. Here’s how:
- Entry Points:
- Enter trades at significant Fibonacci levels (e.g., 61.8% or 88.6%) where the price is likely to reverse.
- Stop-Loss Placement:
- Place stop-loss orders slightly beyond the next Fibonacci level (e.g., 100% if entering at 88.6%).
- Take-Profit Levels:
-
- Target higher Fibonacci extensions (e.g., 161.8% or 261.8%) for exit points.
-
Example Strategy:
- Setup: Enter at the 88.6% retracement level.
- Stop-Loss: Place just below the 100% retracement level.
- Take-Profit: Aim for a 161.8% extension or previous swing high.
- Risk-Reward: This setup often yields a ratio of 1:3 or higher, making it highly profitable over time.
Benefits of Using Higher Timeframes
Using Fibonacci retracements on daily or weekly charts provides more reliable signals due to reduced market noise. These timeframes allow for better risk-reward setups, as the price tends to respect key levels more consistently.
Key Points:
- Higher timeframes reduce the impact of intraday volatility.
- Significant levels on daily/weekly charts often align with institutional trading activity.
- Trading less frequently but with higher accuracy improves long-term profitability.
Conclusion
Customizing Fibonacci retracement levels in MetaTrader can transform your trading approach. By adding levels like 88.6% and analyzing higher timeframes, you can identify precise entry and exit points, improve the risk-reward ratio, and achieve better consistency. Experiment with these adjustments and incorporate them into your strategy for optimal results.


