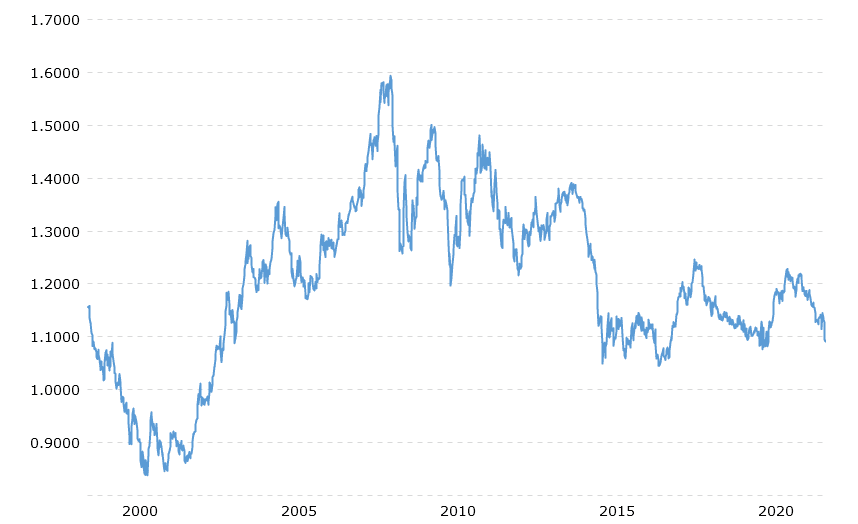
Euro-dollar exchange rate history
The chart below represents the whole Euro-dollar exchange rate history. Euro historical rates chart represents every month EURUSD exchange rate. The Euro exchange rate last five years shows a downtrend but with a moderate and stable exchange rate where the euro currency fluctuation is moderate.

As we can see, the EURUSD historical chart shows that in 2001 and 2002, the price of EURUSD was below 1. In April 2008, before the world crisis, EURUSD’s highest price was 1.5936. After that, EURUSD is in a moderate downtrend and oscillates from 1.12 to 1.24.
Below is presented Euro-Dollar Exchange Rate History Chart by year:
| Year | EURUSD Average Closing Price | Year Open | Year High | Year Low | Year Close | Annual% Change |
|---|---|---|---|---|---|---|
| Euro to Dollar History 2021 | 1.2 | 1.21 | 1.23 | 1.17 | 1.17 | -0.0391 |
| Euro to Dollar History 2020 | 1.14 | 1.12 | 1.23 | 1.07 | 1.22 | 0.0886 |
| Euro to Dollar History 2019 | 1.12 | 1.15 | 1.15 | 1.09 | 1.12 | -0.0226 |
| Euro to Dollar History 2018 | 1.18 | 1.2 | 1.25 | 1.12 | 1.15 | -0.0436 |
| Euro to Dollar History 2017 | 1.13 | 1.05 | 1.2 | 1.04 | 1.2 | 0.1415 |
| Euro to Dollar History 2016 | 1.11 | 1.09 | 1.15 | 1.04 | 1.05 | -0.0318 |
| Euro to Dollar History 2015 | 1.11 | 1.2 | 1.2 | 1.05 | 1.09 | -0.1021 |
| Euro to Dollar History 2014 | 1.33 | 1.37 | 1.39 | 1.21 | 1.21 | -0.1202 |
| Euro to Dollar History 2013 | 1.33 | 1.32 | 1.38 | 1.28 | 1.38 | 0.0426 |
| Euro to Dollar History 2012 | 1.29 | 1.3 | 1.35 | 1.21 | 1.32 | 0.0192 |
| Euro to Dollar History 2011 | 1.39 | 1.34 | 1.48 | 1.29 | 1.29 | -0.032 |
| Euro to Dollar History 2010 | 1.33 | 1.44 | 1.45 | 1.19 | 1.34 | -0.0666 |
| Euro to Dollar History 2009 | 1.39 | 1.39 | 1.51 | 1.25 | 1.43 | 0.0247 |
| Euro to Dollar History 2008 | 1.47 | 1.47 | 1.6 | 1.25 | 1.4 | -0.0419 |
| Euro to Dollar History 2007 | 1.37 | 1.32 | 1.49 | 1.29 | 1.46 | 0.1052 |
| Euro to Dollar History 2006 | 1.26 | 1.2 | 1.33 | 1.18 | 1.32 | 0.1143 |
| Euro to Dollar History 2005 | 1.24 | 1.35 | 1.35 | 1.17 | 1.18 | -0.1259 |
| Euro to Dollar History 2004 | 1.24 | 1.26 | 1.36 | 1.18 | 1.36 | 0.0761 |
| Euro to Dollar History 2003 | 1.13 | 1.04 | 1.26 | 1.04 | 1.26 | 0.2009 |
| Euro to Dollar History 2002 | 0.95 | 0.9 | 1.05 | 0.86 | 1.05 | 0.1786 |
| Euro to Dollar History 2001 | 0.9 | 0.95 | 0.96 | 0.84 | 0.89 | -0.0556 |
| Euro to Dollar History 2000 | 0.92 | 1.01 | 1.03 | 0.83 | 0.94 | -0.066 |


