Table of Contents
Trading currencies can be challenging, but incorporating structured strategies can significantly improve outcomes. One practical approach is a strategy that focuses on trading the GBP/USD currency pair, mainly during GDP report releases. This article will detail my strategy, explaining each step to help traders understand and implement it effectively.
Before you start reading this article, watch my video about GDP trading strategy and my boom crash selling on resistance:


Step 1: Setting Up the Chart
Using the Relative Strength Index (RSI)
The first step involves setting up the Relative Strength Index (RSI) on the daily chart. The RSI is a momentum oscillator that measures the speed and change of price movements. It ranges from 0 to 100, with levels above 70 indicating overbought conditions and below 30 indicating oversold conditions. This indicator helps identify the overall trend direction and potential reversal points.
Step 2: Identifying the Trend
Once the RSI is set up, observing the daily chart is crucial to determine the current trend. This strategy focuses on identifying bearish trends. In a bearish trend, the price movement typically follows a cycle of “down, up, down, up” patterns. Recognizing these cycles is essential for timing trades accurately.
Step 3: Zooming into the Hourly Chart
Switch to the hourly chart to better understand the price movements. This helps you understand the market dynamics and pinpoint entry and exit points. Observing recent price actions, such as bearish solid moves followed by brief recoveries, is essential.

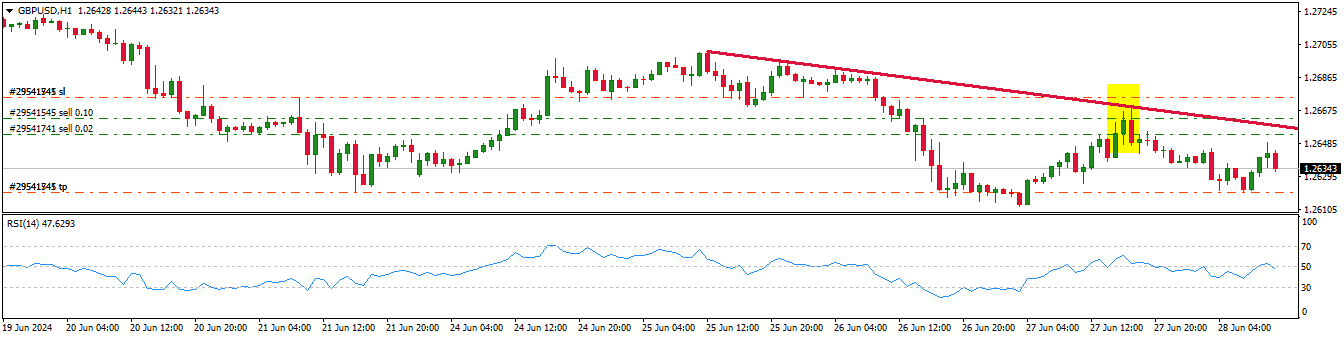
Using yellow color, I showed a moment of the GDP report announcement. An engulfing bearish candle occurs one hour later, and the trend switches to bearish following the primary bearish trend.
Step 4: Key Levels and Resistance Lines
Drawing Resistance Levels
One critical aspect of this strategy is drawing resistance levels. Resistance levels are price points the market has historically struggled to break through. These levels can be identified by looking for points where the price has touched and retreated multiple times. During GDP report releases, the price often touches the resistance trendline before making a significant move.
Step 5: Analyzing the GDP Report Impact
Understanding the GDP Report
GDP (Gross Domestic Product) reports are crucial economic indicators that reflect a country’s overall economic health. Positive GDP news typically strengthens the currency, while negative news can weaken it. However, the immediate market reaction can be unpredictable. The initial reaction might not align with the expected outcome due to the composite nature of GDP results, which combine various economic factors.
Please see my screenshot of GDP report:
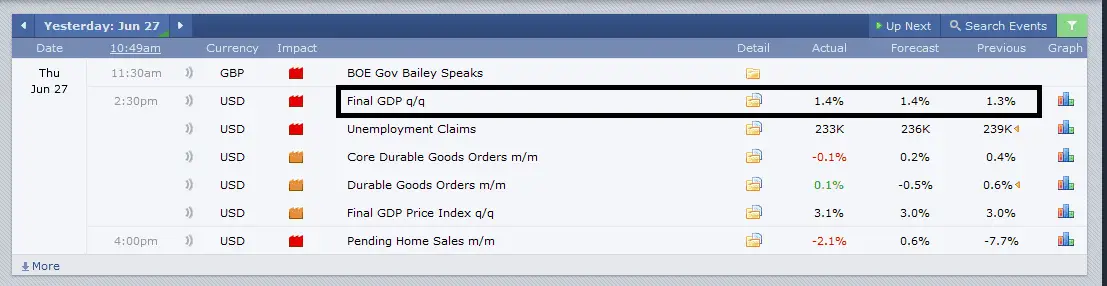
In my experience, the market’s reaction to GDP news tends to be delayed by about an hour. Immediately after the news release, a flurry of activity is often driven by algorithms and pre-positioned trades, creating a lot of noise and misleading initial movements. It usually takes around an hour for the market to fully digest the news, analyze the comprehensive data, and for the natural trend to emerge. This delay provides a crucial window for traders to make more informed decisions based on the proper direction of the market.
Observing Initial Reactions
When the GDP report is released, monitor the immediate market reaction. Sometimes, instead of a bearish move, the market might initially react with a bullish candle. This can confuse beginners, but understanding that the market direction often reveals itself an hour after the news can provide clarity.
Step 6: Timing the Trade
Entering the Trade
After identifying the resistance level and observing the initial market reaction to the GDP report, it’s time to enter the trade. My strategy involves placing a sell trade when the price touches the resistance line during the GDP report release. I suggest placing multiple trades to ensure coverage if a few pips miss the entry point.
Step 7: Managing the Trade
Setting Stop Loss and Take Profit Levels
Risk management is crucial in trading. I recommend setting a stop loss just above the resistance level to limit potential losses. Aim for a reasonable distance for the take-profit target that aligns with the expected market move. The anticipated drop could be around 20 to 30 pips in this strategy.
Step 8: Recognizing the Cycles
Importance of Market Cycles
Understanding and recognizing market cycles is fundamental to this strategy. Observe the “down, up, down” patterns on the daily chart. Typically, in a bearish trend, the down phases are more prominent than the up phases. This observation helps predict the overall market direction and plan trades accordingly.
Step 9: Continuous Monitoring and Adjustment
Trading requires constant monitoring and adjustments based on market conditions. Monitor how the market behaves after you enter the trade and be prepared to adjust your positions.
Conclusion
This trade was made when the hourly, 4-hour, and daily chart timeframes were bearish after the 30-minute chart ended a bullish leg following excellent results for the US dollar.
Trading the GBP/USD pair during GDP report releases can be profitable with a well-defined strategy. My method combines technical analysis using RSI, identifying key resistance levels, understanding market reactions to economic reports, and effective risk management. By following these steps, traders can enhance their chances of success in the forex market. Remember, practice and continuous learning are essential to mastering any trading strategy. Happy trading!

He is an expert in financial niche, long-term trading, and weekly technical levels.
The primary field of Igor's research is the application of machine learning in algorithmic trading.
Education: Computer Engineering and Ph.D. in machine learning.
Igor regularly publishes trading-related videos on the Fxigor Youtube channel.
To contact Igor write on:
igor@forex.in.rs
Related posts:
- VIX and Stochastic RSI Strategy – Volatility-Based Trading Strategy!
- Forex Weekly Strategy Based on 200 Moving Average
- Rule Based Trading System
- Will CRO Crash? – CRO Coin Price Today
- Fibonacci Retracement Trading Strategy! – Golden Ratio Strategy!
- The Best 4h Trading Strategy
- The Best Divergence Trading Strategy
- The Best Forex Trading Strategy that Work?
- 1-minute Scalping Trading Strategy Example Using EMA20
- Engulfing Trading Strategy – Case Study
- No Indicator Trading Strategy Still Working After 60 Years!
- 52 Weekly SMA Trading Strategy for Monthly Profits!
