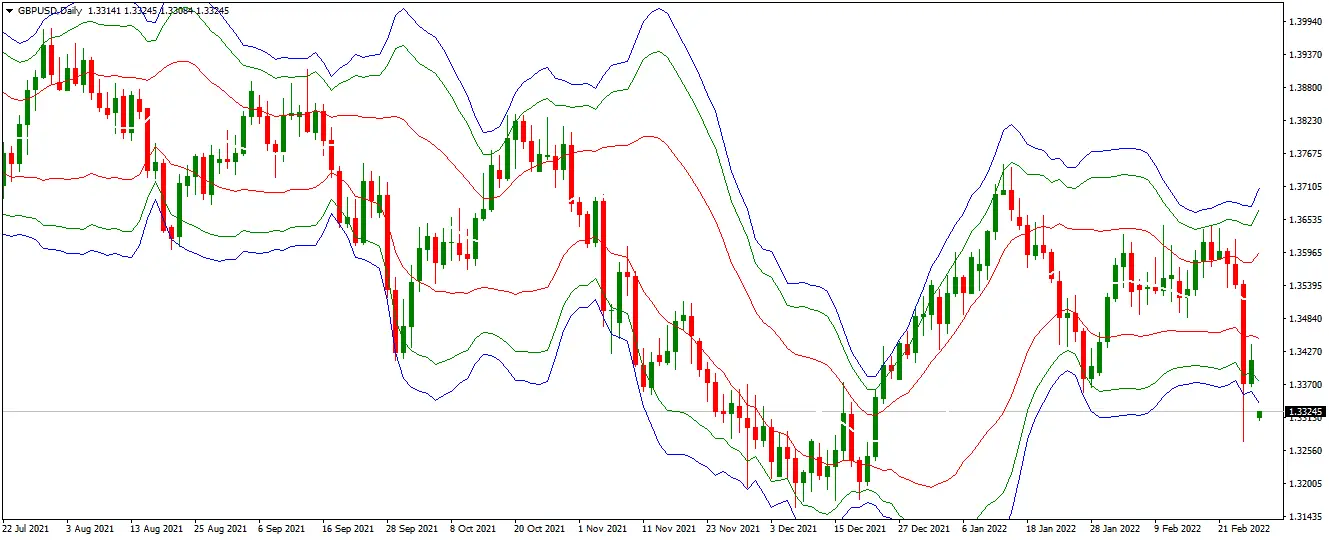
The VWAP indicator is a technical analysis tool that calculates the average price of a stock or index by considering both price and trading volume. The calculation of the VWAP involves multiplying the cost of each transaction by its respective volume and dividing the total value by the total trading volume for a given period.
Traders commonly use the VWAP indicator to determine the fair value of a stock or index over a given time period. In addition, it is often used as a benchmark for traders to assess whether the current price is above or below the average price. If the current price is above the VWAP, it is considered bullish; if it is below the VWAP, it is considered bearish.
Traders can use the VWAP indicator in a variety of ways, such as:
Trading with the trend: Traders can use the VWAP indicator to identify the trend of a stock or index over a given period. For example, if the VWAP is trending up, it can indicate a bullish trend; if it is trending down, it can mean a bearish trend.
Identifying support and resistance levels: Traders can use the VWAP indicator to identify potential support and resistance levels where the stock or index may encounter buying or selling pressure.
Trading breakouts: Traders can use the VWAP indicator to identify breakouts from a trading range. If the price moves above the VWAP after being below it for an extended period, it can signal a potential breakout to the upside.
How to Read VWAP?
The VWAP indicator is a popular technical indicator used in trading to analyze a stock’s price movement or index. Here are some key points on how to read the VWAP indicator:
- The VWAP line is typically plotted on a price chart and represents the average price of a stock or index over a specific period.
- The VWAP line is often used as a benchmark for intraday traders to assess whether the current price is above or below the average price.
- When the price is above the VWAP line, it is considered bullish, and traders may look for buying opportunities.
- When the price is below the VWAP line, it is considered bearish, and traders may look for selling opportunities.
- The VWAP indicator can also be used with other technical indicators, such as moving averages and volume indicators, to confirm potential buy or sell signals.
- The VWAP indicator can also identify potential support and resistance levels, where traders may look to enter or exit a trade.
- Traders may also use the VWAP indicator to identify potential trend changes or reversals, especially when the price crosses above or below the VWAP line.
- It’s important to remember that the VWAP indicator should be used with other analysis tools and risk management techniques to minimize risk and maximize potential profits. As with any technical indicator, there are no guarantees of future performance.
To download and learn more about Volume Weighted Average Price VWAP Strategy, read our article.


