Table of Contents
U.S. elections introduce heightened volatility in the financial markets, driven by the uncertainty and potential policy shifts accompanying a new administration. Traders closely monitor trends to capitalize on these fluctuations, especially within the S&P 500, which has shown distinctive behavior across election cycles. Look at past election trends and some strategies for approaching trades around these pivotal moments.
See my video about trading post-election:
Historical Market Performance During U.S. Elections
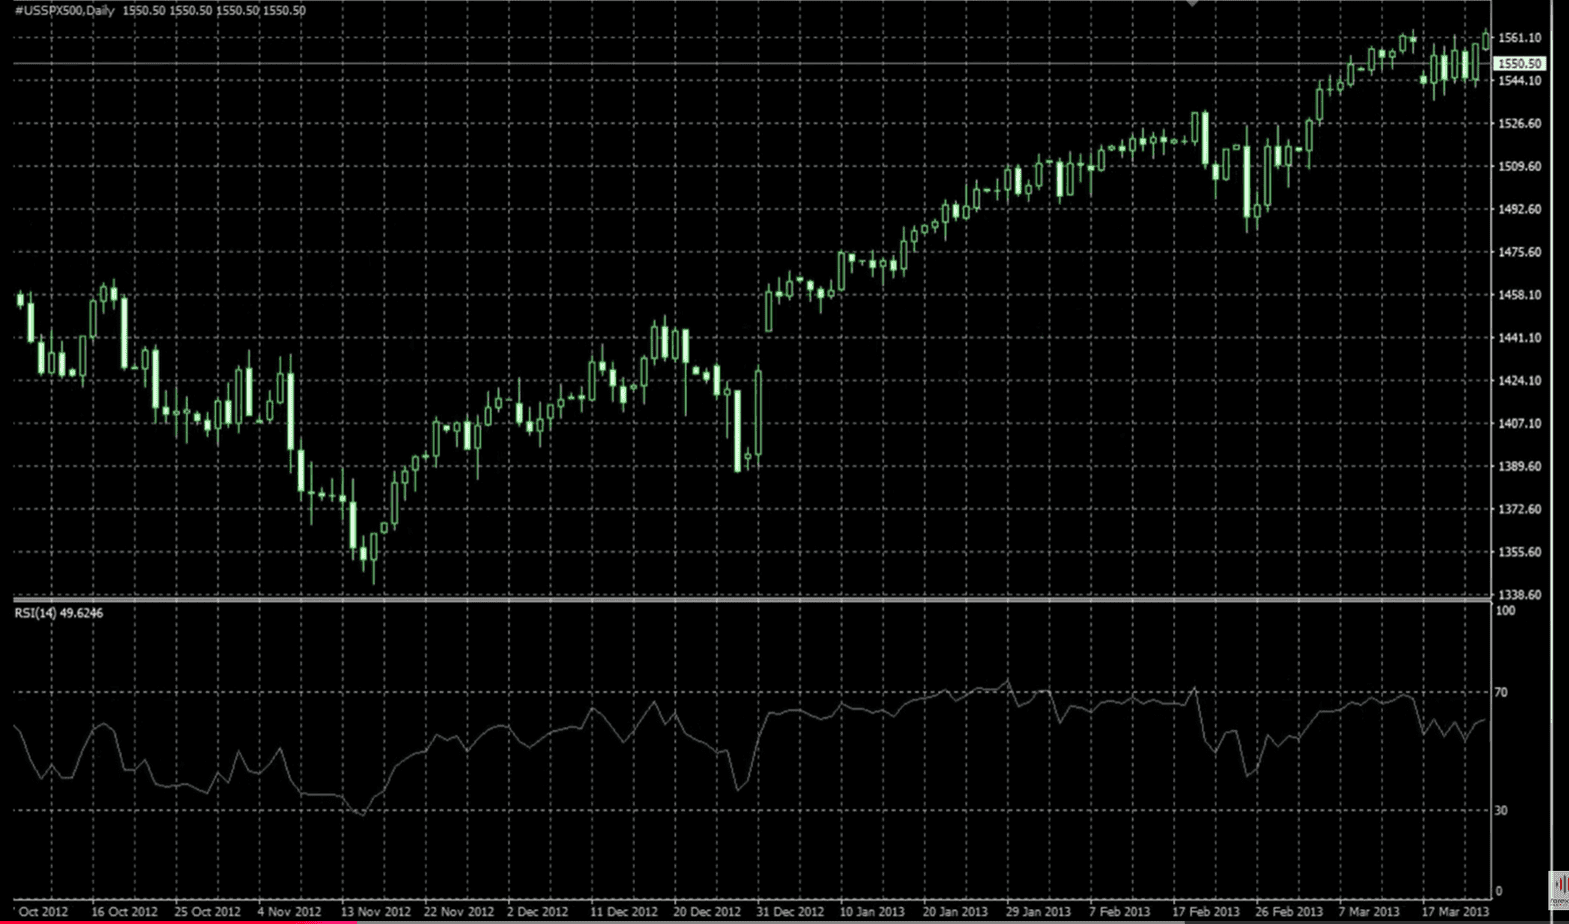
2012 Election – Obama vs. Romney
In 2012, the S&P 500 exhibited a notable pattern leading into and after the November election. During October, the market experienced a bearish trend, likely due to economic and political uncertainties as the campaigns intensified. However, starting in early November, the bearish trend continued into mid-November, after which a significant shift occurred. Around November 15, the market rebounded sharply, transitioning into a strong bullish trend. This trend was sustained for several months, creating one of the strongest rallies, with the S&P 500 climbing from around 1,352, marking a clear buying opportunity for traders.

2016 Election – Trump vs. Clinton
The 2016 election brought another dynamic shift, with Donald Trump winning the presidency. Initially, on November 9, there was a solid bullish candle in the S&P 500, marking the beginning of an upward trend that lasted through the end of the year and into January. Traders who recognized the post-election rally could position themselves for profitable trades, expecting that market optimism about potential economic changes would drive prices higher.
2020 Election – Biden vs. Trump
The 2020 election was marked by substantial market uncertainty due to the COVID-19 pandemic. However, the S&P 500 once again showed resilience. The market entered a bullish trend at the beginning of November and continued this upward momentum for several months, aligning with the post-election rally pattern in previous years. The consistent rise after election day for traders provided clear signals to take long positions, particularly in U.S. indices.
Analyzing S&P 500 Patterns: The Six-Week Post-Election Rally
A key takeaway from studying the past 20 years of U.S. election data is the tendency for a bullish trend in the last six weeks of the year. This pattern emerged consistently, with approximately 70% of post-election years showing an upward trend through late November and December. This provides a high-probability setup for traders to consider buying U.S. indices during this period, anticipating potential gains as the market responds to election outcomes.
- October Setup: Watch for bearish or consolidative movements leading to the election.
- November Entry: Look for signs of a reversal after the election, particularly around mid-November.
- Hold Through December: Historically, the S&P 500 tends to rise through December, offering a six- to eight-week bullish window.
Current Election Cycle Strategy
For the upcoming election, traders can apply similar principles. Here are the key elements to monitor:
- Trend Lines and Technical Indicators: Tools like the Relative Strength Index (RSI) can help identify overbought or oversold conditions. A breakout above resistance on the S&P 500 or a clear bullish signal on RSI can indicate a potential entry point for long trades.
- Market Response on Election Night: Historically, a strong reaction on election night may set the tone for the next few days. If the first trading day after the election shows bullish momentum, it may signal the start of the anticipated rally.
- Risk Management: While historical patterns suggest a bullish outcome, it’s essential to consider that each election brings unique circumstances. Setting stop-loss orders and scaling into positions can mitigate potential risks in case of a deviation from historical trends.
Currency Trading During U.S. Elections
Currencies, particularly pairs involving the U.S. dollar, can also experience election-related volatility. The dollar has shown mixed behavior in the past, with periods of both bullish and bearish trends depending on the market’s reaction to the new administration’s policies.
For example, in 2020, the British Pound (GBP/USD) displayed a bullish trend starting in November, coinciding with the upward stock trend. Generally, if U.S. indices perform strongly, the dollar might weaken as investor confidence shifts to equities. This trend has been less consistent, with about 70% of cases showing dollar weakness during the post-election period. Here’s a suggested approach:
- Monitor Dollar-Centric Pairs: Key pairs like GBP/USD and EUR/USD often gain strength if U.S. equities rally and the dollar softens.
- Watch for Reversals: November has historically seen shifts in currency trends, making it a critical time to monitor breakouts and retracements, especially if stocks rally.
Why will Equities react positively if Trump Wins?
If Trump wins a U.S. election, the equities market might respond positively based on historical patterns, policy expectations, and investor sentiment.

Here’s a detailed look at the factors behind this potential rally:
1. Market-Friendly Policies
Trump’s administration is generally perceived as favorable to businesses and economic growth, mainly due to its focus on:
- Tax Cuts: His previous administration introduced significant corporate tax cuts, which boosted profits for many companies. Investors anticipate similar policies in a second term, as lower taxes translate directly to increased corporate earnings.
- Deregulation: Trump has historically emphasized reducing regulations on businesses, particularly in energy, financials, and other heavy industries. By decreasing regulatory costs and barriers, companies can operate with fewer expenses, making better profit margins favorable for stock prices.
2. Infrastructure and Stimulus Expectations
During his previous term, Trump emphasized infrastructure spending to boost economic growth and job creation. A win could lead investors to expect more government spending on infrastructure, which can positively impact sectors like construction, industrials, and materials, creating optimism across the market.
3. Pro-Business Stance on International Trade
Although Trump’s trade policies, especially tariffs, have led to temporary market volatility, investors may believe his approach could benefit U.S. companies in the long term by pushing for favorable terms. This stance often supports domestic industries, and investors might anticipate that his policies will ultimately lead to more vital domestic companies and less dependence on foreign suppliers.
4. Investor Confidence and Sentiment
Certain investor groups and financial institutions may have confidence in Trump’s ability to stimulate economic growth, reduce unemployment, and create a pro-growth environment. This sentiment can lead to increased demand for equities as investors position themselves for a potential economic upswing.
5. Historical Market Trends
Historically, Trump’s election victory 2016 was followed by a significant rally in the U.S. stock market, particularly in the S&P 500. Investors remember the bullish momentum from that period, and many might expect similar market behavior if Trump were elected again. This can create a self-fulfilling effect where expectations of a rally drive actual price increases.
6. Industry-Specific Gains
A Trump victory often brings enthusiasm in specific sectors:
- Energy Sector: Trump’s policies favor fossil fuel industries, so oil and gas companies may rally on expectations of less regulatory pressure and support for domestic production.
- Defense and Aerospace: Increased defense spending is often anticipated, which benefits companies that manufacture military equipment and technology.
- Financial Sector: A deregulatory stance on financial services may help boost banks and other financial institutions, making the sector attractive for investment.
7. Reduced Corporate Regulation on Social Policies
Trump’s policies may ease social mandates on companies, which can reduce operational costs and administrative burdens for large corporations. This reduced overhead can positively impact profit margins, leading to higher stock valuations.
Example Strategy: S&P 500 and Forex Pair Trades
- Indices Buy Setup: If a bullish trend develops, initiate long positions on the S&P 500 or other U.S. indices around mid-November.
- Forex Setup: If the dollar shows signs of weakening against other major currencies, consider buying the EUR/USD or GBP/USD.
- Exit Strategy: Hold positions through the end of the year, or until early January, with a trailing stop to lock in profits as the rally progresses.
Summary and Key Takeaways
Trading around U.S. elections requires a strategic approach rooted in historical analysis and technical insight. The tendency for U.S. indices to rally after elections provides a promising setup, while currency pairs may also offer opportunities, albeit with mixed predictability. By focusing on the last six to eight weeks of the year and adjusting trades based on real-time market reactions, traders can effectively leverage the election’s impact on financial markets.


