Table of Contents
Trendlines are an essential tool in many traders’ arsenals. They provide a visual representation of price movements and potential turning points. When used effectively, trendlines can simplify decision-making, helping traders identify optimal entry and exit points in various markets, such as Forex, stocks, or commodities.
Before we start, check my video:


In this article, we’ll explore the mechanics of trendline strategy and provide a step-by-step guide to using this powerful tool in volatile trading environments, such as that observed in the British Pound (GBP/USD) around the CPI release.
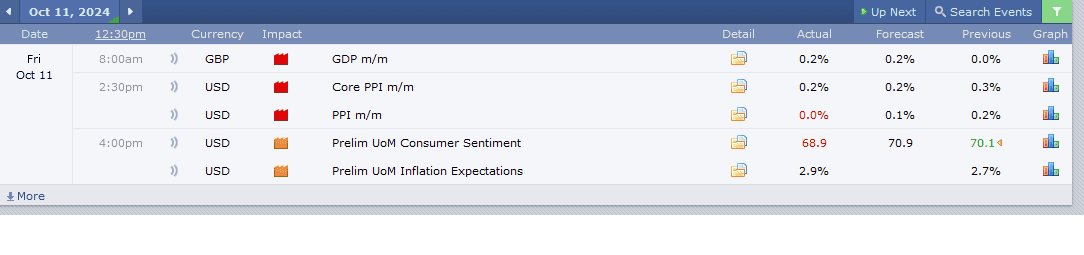
See Forex factory calendar:

The Foundation of Trendlines in Trading
A trendline is a straight line drawn between two or more price points, typically connecting the highs or lows of a market trend. The primary purpose of trendlines is to identify the prevailing direction of price movement—either up (bullish), down (bearish), or sideways (range-bound). These lines help traders visually recognize the overall market sentiment and detect areas of potential support or resistance.
In an uptrend, the trendline is drawn along the lows, supporting price as it moves upward. The trendline connects the highs in a downtrend, acting as a resistance level.
Key Points About Trendlines:
- Uptrend: Trendline drawn connecting higher lows.
- Downtrend: Trendline drawn connecting lower highs.
- Touch Points: At least two points are required to draw a valid trendline, though more touches confirm its strength.
- Breaks: A trendline break can signal a reversal or a significant market event, depending on the context.
Practical Application: GBP/USD Trendline Strategy Example
Consider a real-world example from a recent trading session involving the GBP/USD. On this occasion, the release of the Consumer Price Index (CPI) report drove significant market volatility, leading to sharp price movements. Understanding how to navigate such conditions using a trendline strategy can make the difference between success and failure.
Step 1: Identifying the Key Levels
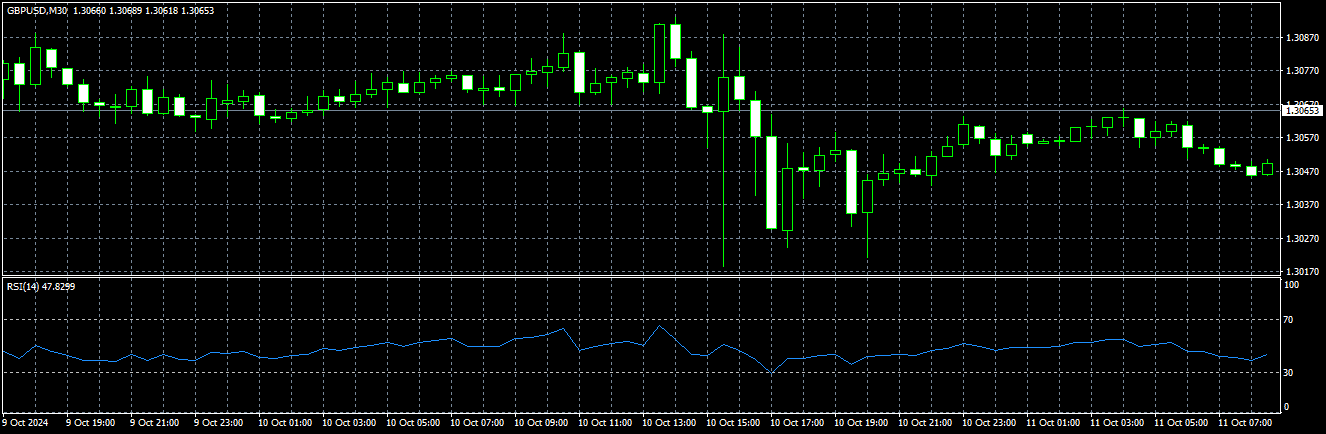
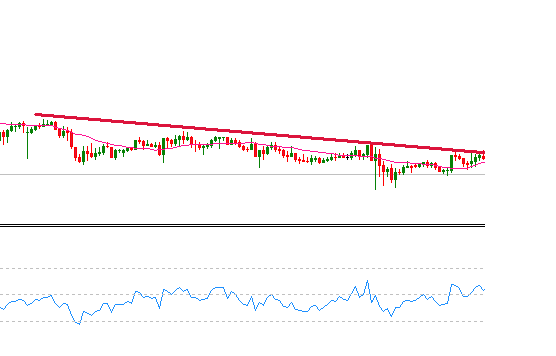
On the day of the CPI report, GBP/USD experienced massive price spikes — from 1.3100 up to 1.3190 within minutes, an 80-pip move in an extremely short period. Such volatile conditions are challenging, but trendlines can help filter the noise and guide your trades. In this case, the previous week’s high (October 7) was significant. A downward trendline was formed by connecting the highs of October 7 and subsequent price action, highlighting potential resistance zones.
Step 2: Drawing the Trendline
To build a trendline effectively, connect the most recent price highs or lows that align with the current trend. In this example, after identifying the high of the week (October 7), the following steps involved plotting additional touches of price action that confirmed the trendline’s strength. As the price approached these levels multiple times without breaking through, it confirmed that the trendline acted as a valid resistance zone.
Here’s a breakdown of the trade setup:
- Highs Identified: A high was set on October 7, and four subsequent touches (including one on the morning of the trading session in question) confirmed the trendline’s validity.
- Price Action: Early in the session, after the price touched the upper trendline, the trader entered a short position. The price then moved downwards, generating a quick 30-pip profit.
Step 3: Evaluating Market Conditions
Before entering a trade, it’s essential to consider market conditions. In the case of GBP/USD, not only were trendlines relevant, but additional technical indicators, like the Relative Strength Index (RSI), showed an overbought condition, increasing the probability of a price decline.
Despite the bearish sentiment, the trader remained cautious about the trendline’s holding ability. The significant volatility surrounding the CPI and other economic reports, such as the Producer Price Index (PPI), also played a crucial role. As such, the trader opted for short-term trades, closing positions as soon as the target level was reached rather than holding onto them for a prolonged period.
Step 4: Adjusting for Volatility
With volatile instruments like GBP/USD, which experienced rapid fluctuations that day, it’s crucial to remain flexible in your strategy. The trader anticipated possible trendline breaks due to the release of inflation data, which often creates temporary imbalances between buyers and sellers. Despite a bearish bias, caution was exercised, and the trader waited for price confirmation before entering further trades.
When to Expect Trendline Breaks
While trendlines are reliable, they are not foolproof. In some cases, price action may break through a trendline, signaling a possible reversal or the continuation of a more significant trend. When this occurs, traders should look for additional confirmation — such as increasing volume or other technical indicators — before deciding.
For instance, if a downtrend line is broken and the price begins to rally, it might indicate that a bullish reversal is imminent. In contrast, a failed break (where the price briefly moves above the trendline but fails to sustain it) could continue the previous trend. In this example, the trader remained aware of the possibility of a false break during the CPI volatility but based decisions on observed price action and technical indicators.
The Role of Technical Indicators
While trendlines are powerful, combining them with technical indicators can enhance trading outcomes. In this scenario, the trader used the RSI to gauge overbought and oversold conditions. When the RSI showed overbought levels, it increased the likelihood that the price would face resistance at the trendline and reverse, which aligned with the trader’s bearish bias.
Additionally, volume analysis was used to assess the strength of institutional buying and selling. Observing increased buying volume during previous uptrends indicated that significant players were attempting to increase prices, adding another insight into the trader’s decision-making process.
Risk Management and Trade Execution
Managing risk becomes even more critical in volatile conditions like those surrounding CPI and PPI releases. The trader in this scenario used short-term trades to lock in profits quickly and limited exposure by exiting trades once the desired level was reached. This approach minimized the potential for loss due to unforeseen market movements.
Essential Risk Management Tips:
- Use Stop-Loss Orders: Place stop-losses just beyond crucial support or resistance levels to protect against unexpected price spikes.
- Take Profit Early: In volatile markets, taking profits early is often better than waiting for more significant gains.
- Position Sizing: Adjust your size to account for increased risk during significant news events, such as CPI or PPI reports.
Conclusion: Mastering the Trendline Strategy
The trendline strategy offers traders a straightforward yet effective way to navigate volatile market conditions. By correctly identifying key levels, using technical indicators, and managing risk, traders can use price movements in trending and choppy markets. In the case of GBP/USD, the trendline served as a reliable guide, helping the trader secure profits even in a highly volatile environment.
To master this strategy, traders should practice drawing trendlines across different time frames and market conditions, ensuring they understand how price action interacts with these lines. With experience, the trendline strategy can become invaluable in any trader’s toolkit.

He is an expert in financial niche, long-term trading, and weekly technical levels.
The primary field of Igor's research is the application of machine learning in algorithmic trading.
Education: Computer Engineering and Ph.D. in machine learning.
Igor regularly publishes trading-related videos on the Fxigor Youtube channel.
To contact Igor write on:
igor@forex.in.rs
