Table of Contents
If you’ve been navigating the complex world of trading, you’ve probably encountered terms like “imbalance,” “inefficiency,” and “liquidity” thrown around. These can be overwhelming, but I’m here to simplify things.
Market prices increase and decrease in waves, with pullbacks as temporary reversals within a more significant trend. These pullbacks happen as traders take profits or react to short-term market factors, creating opportunities for re-entry before the trend continues.

What is the Fair Value Gap?
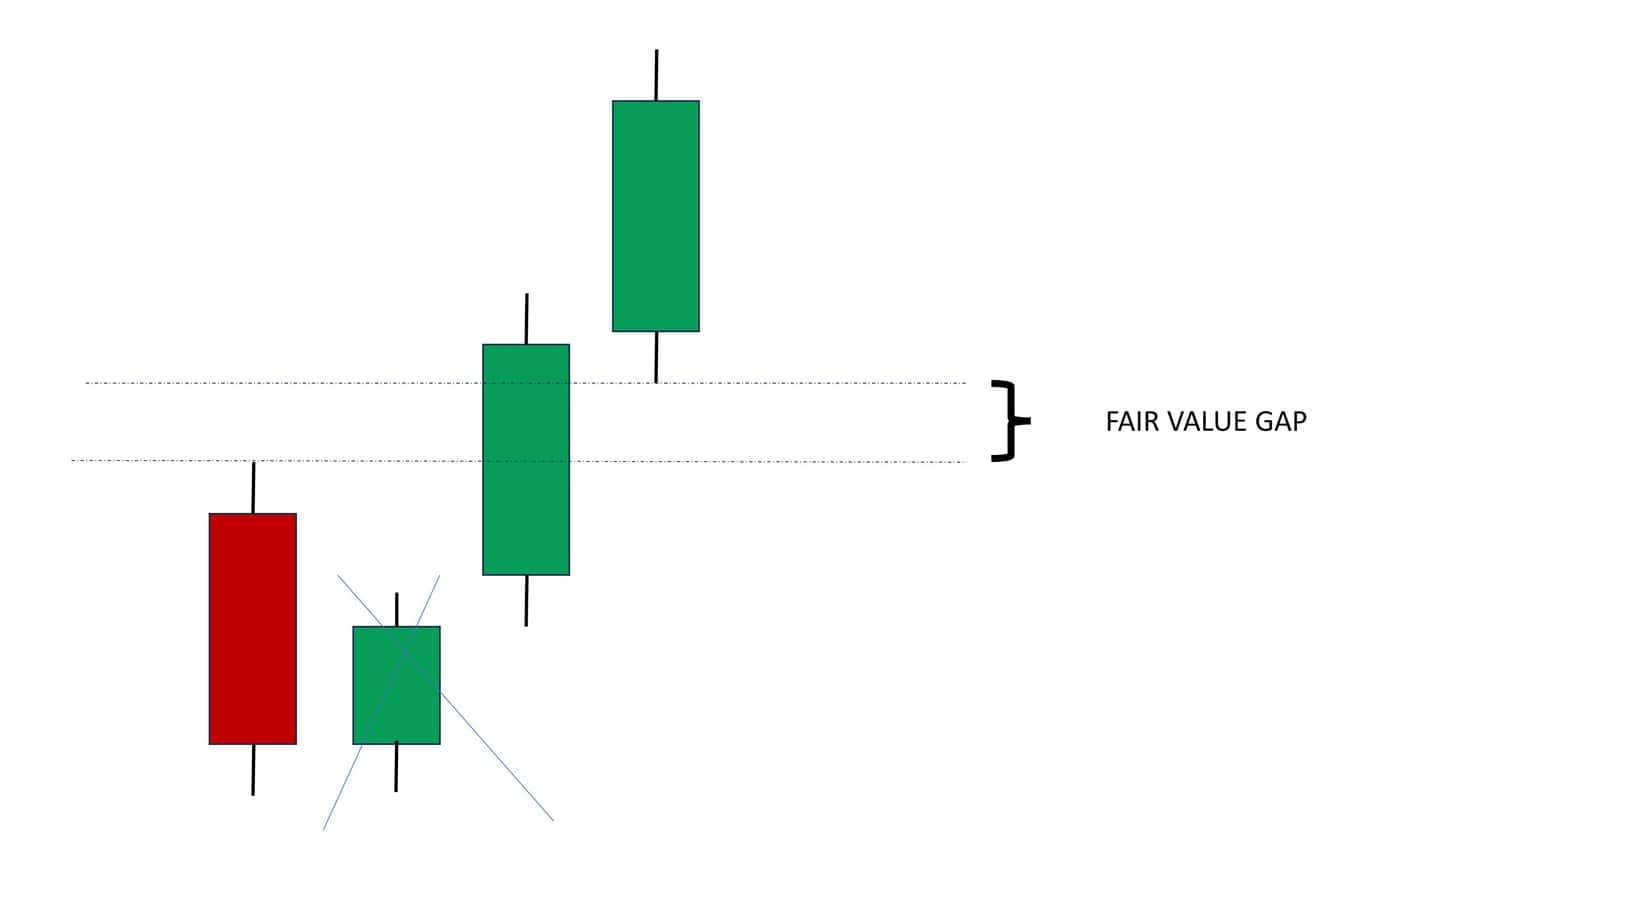
The Fair Value Gap (FVG) is a concept used to identify areas in the market where a price imbalance has occurred due to rapid price movement. A gap is left on the price chart between two consecutive candles. This gap often indicates where the price may return, allowing traders to find potential entry points after a pullback.
Please see my video explanation about the Fair Value Gap:
Why Should You Care About Fair Value Gaps?
In bullish and bearish trends, the market doesn’t move in a straight line; there are pullbacks. The key to successful trading is identifying these pullbacks and determining the best time to place a buy or sell order. The Fair Value Gap is instrumental in locating these areas of potential pullback, offering you a higher probability entry point.
How to Identify a Fair Value Gap
To make things straightforward, let’s break it down with an example. Imagine you have three consecutive bullish candles on your chart:
- The first candle closes bullish.
- The second candle also closes bullish.
- The third candle closes bullish as well.
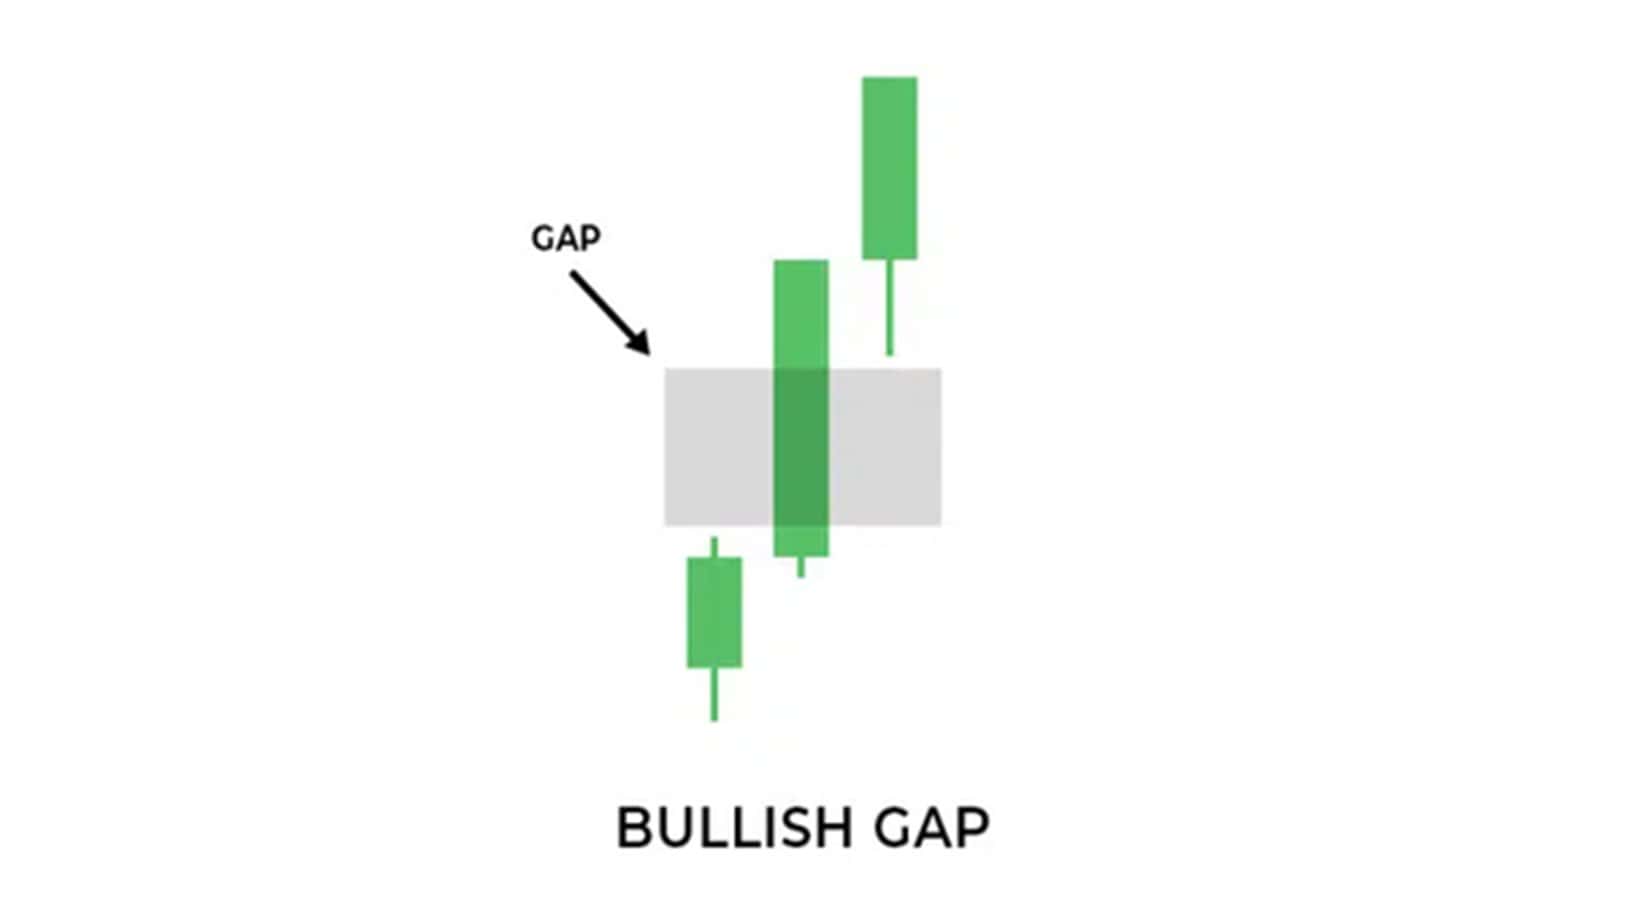
To find the Fair Value Gap, you focus on the first and the last candle. Specifically, you’ll look at the first candle’s highest high and the third candle’s lowest low. The gap between these points forms your FVG.
For a Bearish Fair Value Gap:
- The first candle closes bearish.
- The second candle also closes bearish.
- The third candle closes bearish.
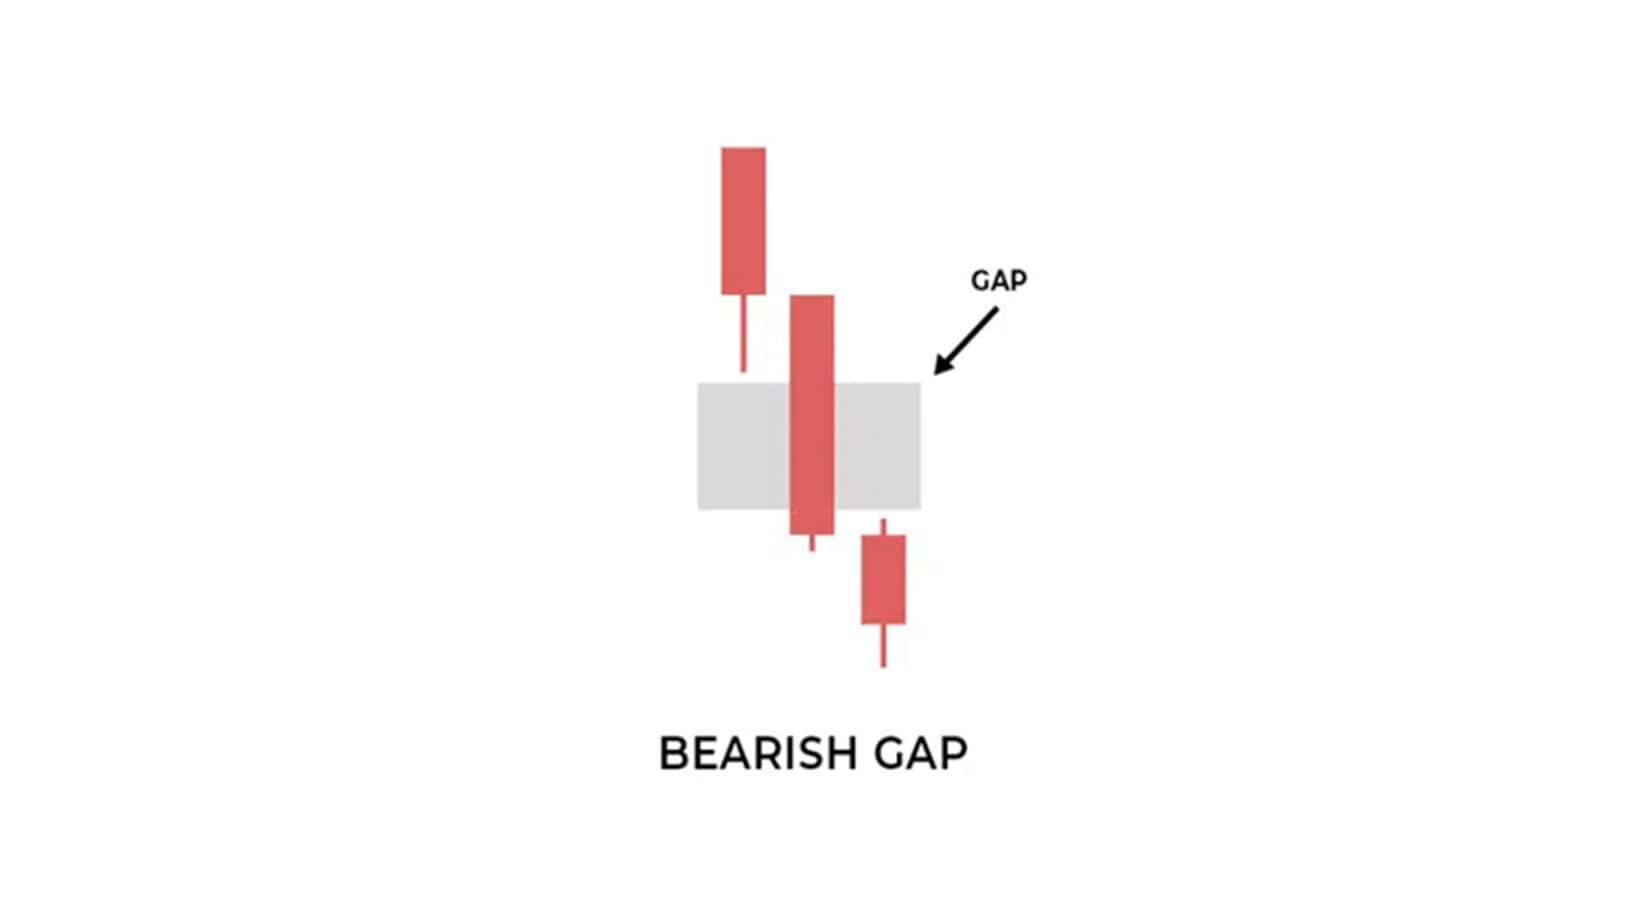
Here, you’ll identify the gap between the first candle’s lowest low and the third candle’s highest high.
Practical Application: Live Chart Example
Let’s bring this to life with a live chart example. Suppose you see three bullish candles forming an FVG. The price makes a pullback after this gap, enters the FVG area, and then resumes its upward movement. This scenario presents an excellent opportunity to place a buy order.
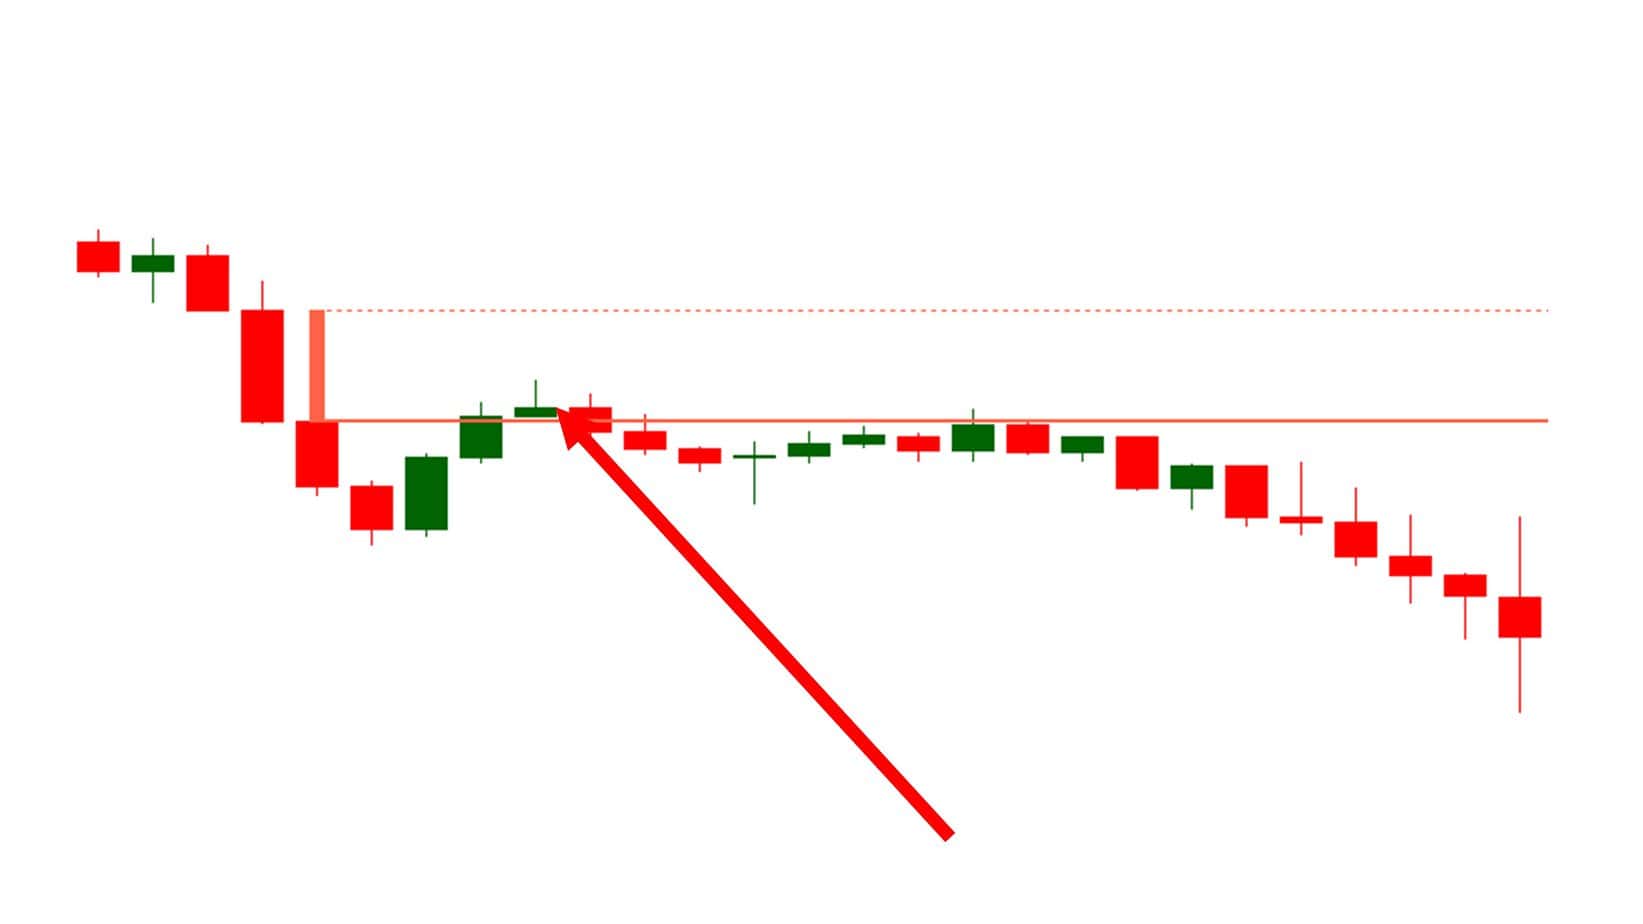
Conversely, three consecutive bearish candles may form a Fair Value Gap in a bearish trend. If the price retraces into this FVG, you might consider placing a sell order, expecting the price to continue its downward trend.
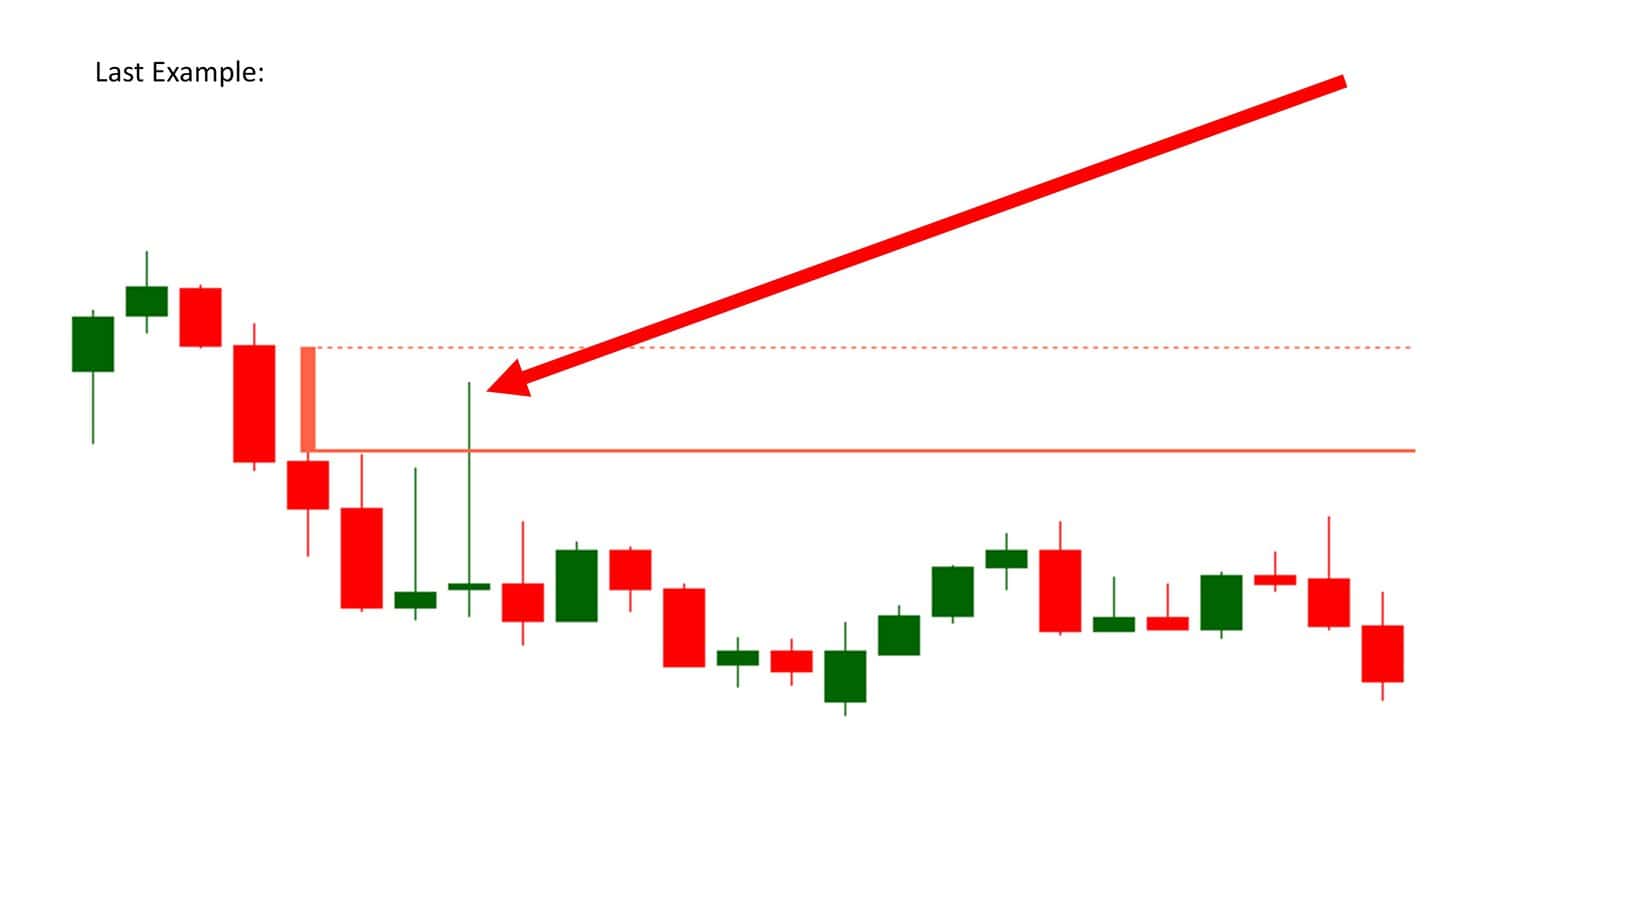
Beware of the “Mother Candle”
While identifying Fair Value Gaps, consider the “Mother Candle.” This significant candle can potentially invalidate a smaller Fair Value Gap if its price range overlaps with the FVG area. If a larger candle (the Mother Candle) engulfs the area of your identified FVG, it might diminish the gap’s relevance as an entry point.
The ICT Concept: Not a Strategy, but a Framework
It’s important to remember that the ICT approach is more of a concept than a rigid strategy. Traders have used the rules it encompasses for decades. ICT organizes these rules into a coherent framework that traders can use as tools for better decision-making.
Don’t get bogged down by fancy terminology or feel pressured to follow every rule of the letter. Trading isn’t an exact science; it’s about finding tools and methods that work for you.
Final Thoughts
The ICT Fair Value Gap is a powerful tool for identifying potential pullback areas, but it’s just one of many tools in a trader’s arsenal. It’s not the Holy Grail, and it won’t guarantee success on its own. Use it to enhance your trading decisions alongside other indicators, such as Fibonacci retracement levels, support and resistance zones, and fundamental analysis.
Remember, trading is about making informed decisions, not following strict rules. Experiment, find what works for you, and enjoy the process.
I hope this explanation has made the Fair Value Gap concept clearer for you. Happy trading, and remember to love what you do!


