Table of Contents
A 15-minute close price chart provides a balanced view of price movements, making it an excellent tool for identifying entry points in trading. This timeframe reduces the noise and false signals often seen in shorter timeframes like the 5-minute chart, offering a clearer picture of the market’s direction.
Traders can observe more substantial price patterns and trends, leading to more reliable trade setups. The 15-minute chart also identifies critical support and resistance levels, enhancing the precision of entry points. Additionally, it strikes a good balance between capturing intraday price action and avoiding the longer wait times associated with higher timeframes. Overall, the 15-minute close price chart helps traders make informed decisions by providing a more stable and coherent view of market behavior.

Usually, I use MACD on 15-minute charts, 1-hour charts, and larger time frames.
The best MACD settings for 15 minute chart
The best MACD settings for a 15-minute chart are parameters 24, 52, and 18. However, in our case study, this setting is only a few percent better than the defaulting 12,26,9.
Experiment Case Study for 15-Minute Chart Best Settings Testing
Indicators Used:
MACD with Several Settings: We tested different combinations of the MACD indicator, including fast EMA settings of 12, 24, and 6; slow EMA settings of 26, 52, and 34; and MACD SMA settings of 5, 9, and 18. Channel Indicator: We used our custom channel indicator for this experiment, but any channel indicator, like the Donchian channel, can be used. Important Level Indicator: Our indicator is based on previous highs and lows. Alternatives such as Pivot points or Fibonacci levels can also be used.
Trading Rules on 15-Minute Charts:
BUY Rules:
- MACD Signal: Enter a buy trade if there is a bullish MACD cross or a cross above the zero line.
- Significant Level Touch: Ensure the price touches a significant level identified by the critical level indicator.
- Bullish Channel: Verify that the price is within a bullish channel.
- Stop Loss: Place the stop loss at the last significant level swing.
- Target: Set the target at the next significant level.
SELL Rules:
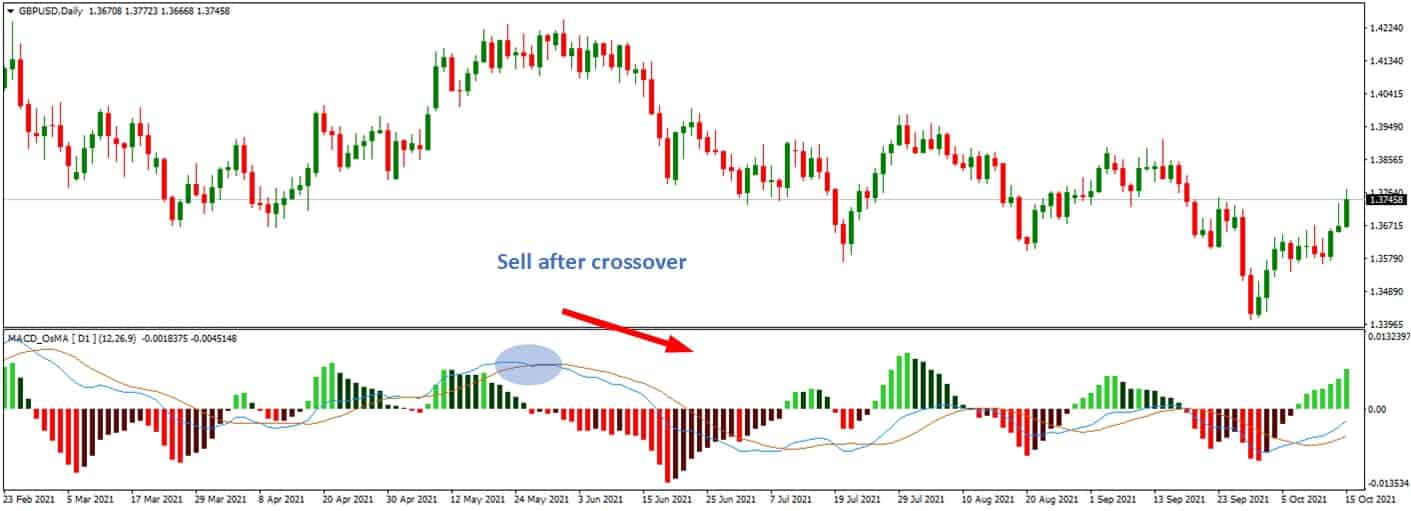
- MACD Signal: Enter a sell trade if there is a bearish MACD cross or a cross below the zero line.
- Significant Level Touch: Ensure the price touches a critical level identified by the significant level indicator.
- Bearish Channel: Verify that the price is within a bearish channel.
- Stop Loss: Place the stop loss at the last significant level swing.
- Target: Set the target at the next significant level.
Combinations Tested:
- Fast EMA: 12, 24, 6
- Slow EMA: 26, 52, 34
- MACD SMA: 5, 9, 18
The testing revealed that the best MACD settings for a 15-minute chart are parameters 24 (fast EMA), 52 (slow EMA), and 18 (MACD SMA). These settings provided the most reliable signals and slightly improved the overall trading performance. However, the improvement was marginal, only a few percent better than the default MACD settings of 12 (fast EMA), 26 (slow EMA), and 9 (MACD SMA).
This slight edge indicates that while the optimized settings can enhance trading accuracy, the default settings are still robust and effective. The custom channel and significant level indicators also played crucial roles in validating entry points, contributing to the strategy’s overall success. Therefore, traders can use the optimized settings for a slight performance boost but can still achieve reliable results with the standard MACD parameters.


