Table of Contents
Range Trading and Mean Reversion are widely used trading strategies, particularly in forex and other financial markets.
Download mean reversion indicators
Here’s a breakdown of each concept:
Range Trading
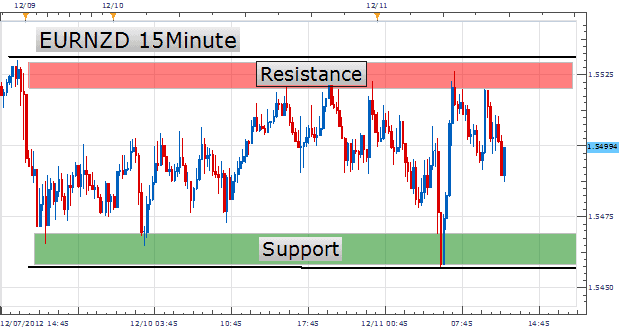
Range trading is based on identifying support and resistance levels in a market where an asset’s price fluctuates between these bounds for some time. Traders aim to capitalize on the predictable price movement within this range.

- Support: The price level where an asset tends to stop falling and starts to rise.
- Resistance: The price level where an asset tends to stop rising and starts to fall.
How It Works:
- Identify the Range: Traders look for horizontal price channels in which the asset moves between a clear support and resistance level.
- Buy at Support: When the price hits or approaches the support level, traders look to buy, expecting the price to bounce back towards resistance.
- Sell at Resistance: When the price approaches resistance, traders sell, expecting the price to fall toward support.
- Stop-Loss and Take-Profit: To manage risk, traders place stop-loss orders below support (for long positions) or above resistance (for short positions). Take-profit levels are usually placed near the opposite side of the range.
Key Characteristics:
- Sideways Market: Range trading typically works best in markets moving sideways without a strong trend.
- Volatility: The market volatility within the range is moderate, allowing the price to oscillate predictably between support and resistance.
Mean Reversion
Mean reversion is the idea that the price of an asset will eventually return to its average or mean level after deviating from it. It assumes that markets are cyclical and that extreme price movements are temporary.

How It Works:
- Identify the Mean: Traders calculate a mean (or average) price, often using a moving average (e.g., 20-day moving average).
- Look for Extremes: When the price deviates significantly from the mean (either rising too high or dropping too low), traders anticipate it will eventually revert to the average.
- Buy Low, Sell High: If the price is below the mean, traders might buy, expecting the price to rise back toward the mean. If the price exceeds the mean, traders might sell or short-sell, expecting it to fall back to the mean.
- Indicators: Tools like Bollinger Bands or the Relative Strength Index (RSI) are often used to measure how far the price has moved from its mean.
Key Characteristics:
- Overbought and Oversold Conditions: Mean reversion is often applied when the market is perceived to be overbought or oversold.
- Works in Non-Trending Markets: Like range trading, this strategy is more effective in markets without a strong trend, as strong trends can result in prices deviating from the mean for extended periods.
Differences Between Range Trading and Mean Reversion:
- Range Trading focuses on specific price levels (support and resistance), while Mean Reversion focuses on the tendency of price to return to its average.
- Range trading may involve oscillating back and forth within a set price range, while mean reversion assumes the price will revert to its historical mean regardless of predefined levels.
Both strategies are based on the belief that price extremes are temporary and that markets often return to equilibrium. However, they are best applied in different types of markets and require a good understanding of price behavior and technical analysis.
My FxIgor’s Range Trading Strategy
FxIgor’s Range Trading Strategy combines range trading principles with mean reversion indicators. The core idea is to capitalize on price fluctuations within a range, explicitly aiming for price movements back to a calculated mean level.

Critical Components of the Strategy:
- Mean Reversion Template:
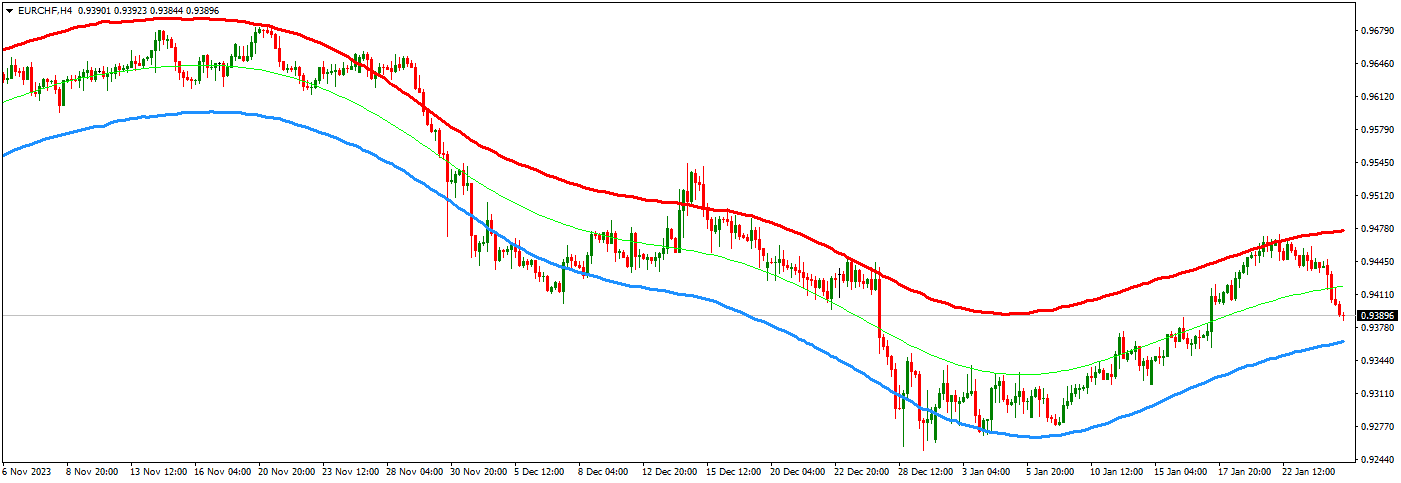
- A green line represents the average or mean price. It’s calculated based on hundreds of price levels.
- Price movements are evaluated about this green line to anticipate mean reversion—the tendency for price to revert to the mean after deviating.
- Using Deviation Levels:
- When the price reaches certain deviation levels (support or resistance), the expectation is for the price to return to the mean (green line).
- On smaller timeframes, such as the 1-minute chart, when the price deviates from the mean (up or down), trades are made in anticipation of the price moving back toward the green line.
- Flat Green Line for Range Trading:
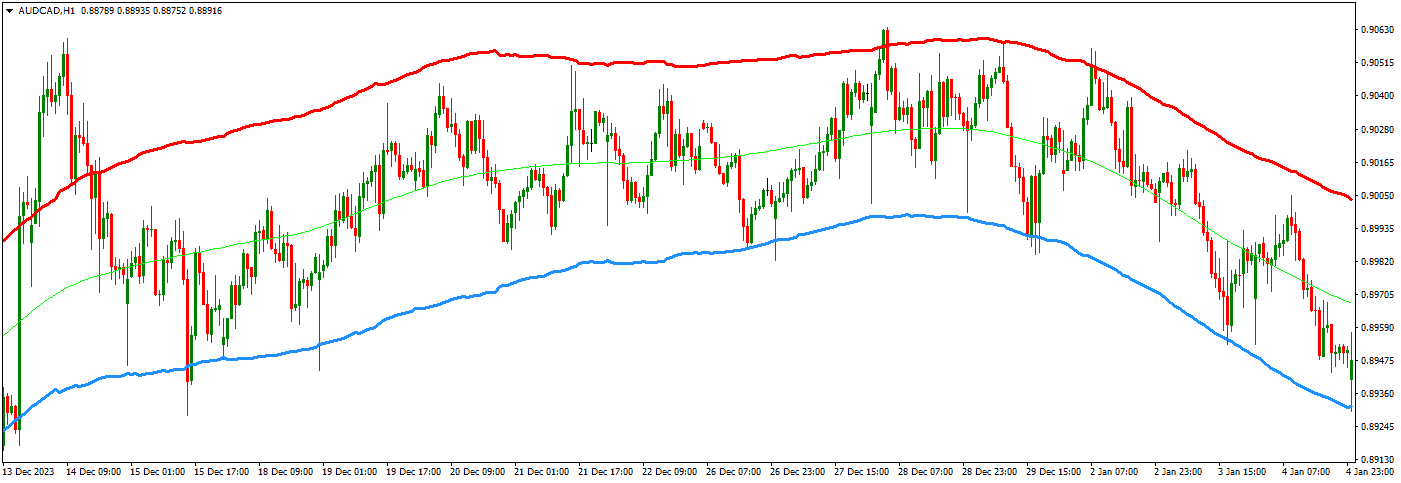
- The strategy is most effective in range-bound markets where the green line (mean price) remains flat. This indicates a stable market with no strong trend, which is ideal for range trading.
- When the green line is flat, the price oscillates between support (blue) and resistance (red). In this case, trades can be placed:
- Buy at support (blue line) and hold until the price reaches the green line or resistance.
- Sell at resistance (red line) and hold until the price drops to the green line or support.
- Timeframes and Markets:
- Ideal forex pairs for this strategy include range-bound pairs, such as AUD/USD, CAD/JPY, or GBP/USD, during non-trending periods.
- The strategy works well during range-bound sessions, like the Asian session, where the market tends to move sideways.
- Adjusting Indicators:
- The multiplier for deviation can be adjusted to fine-tune how far the price is from the mean. For example, setting the multiplier to 2.6 adjusts the distance between the support and resistance lines.
- Caution Against Trending Markets:
- While mean reversion works well in range markets, avoiding strong trends is essential. In trending markets, the price may not revert to the mean for an extended period, increasing the risk of loss.
Advantages and Challenges:
- High Winning Rate: The strategy boasts a high success rate, around 80-90%, as price often reverts to the mean in range-bound conditions.
- Risk-Reward Trade-off: While the strategy produces many winning trades, the risk-reward ratio can be lower because, in rare cases, the price may take longer to revert, resulting in more significant losses.
In summary, FxIgor’s strategy relies on finding stable, non-trending markets and leveraging mean reversion indicators to trade within predictable ranges, using support, resistance, and the mean price level as critical markers for entry and exit.
He is an expert in financial niche, long-term trading, and weekly technical levels.
The primary field of Igor's research is the application of machine learning in algorithmic trading.
Education: Computer Engineering and Ph.D. in machine learning.
Igor regularly publishes trading-related videos on the Fxigor Youtube channel.
To contact Igor write on:
igor@forex.in.rs
Related posts:
- Trading Strategy for GBP/USD Based on GDP Reports – Boom Crash strategy
- VIX and Stochastic RSI Strategy – Volatility-Based Trading Strategy!
- Best Forex Pairs For Mean Reversion Strategy!
- What is Narrow Range 7? – NR7 Strategy
- What is the Opening Range Breakout Strategy?
- Forex Weekly Strategy Based on 200 Moving Average
- Newsletter – Get Free Mean Reversion Strategy
- Rule Based Trading System
- Fibonacci Retracement Trading Strategy! – Golden Ratio Strategy!
- The Best 4h Trading Strategy
- The Best Divergence Trading Strategy
- The Best Forex Trading Strategy that Work?


