Table of Contents
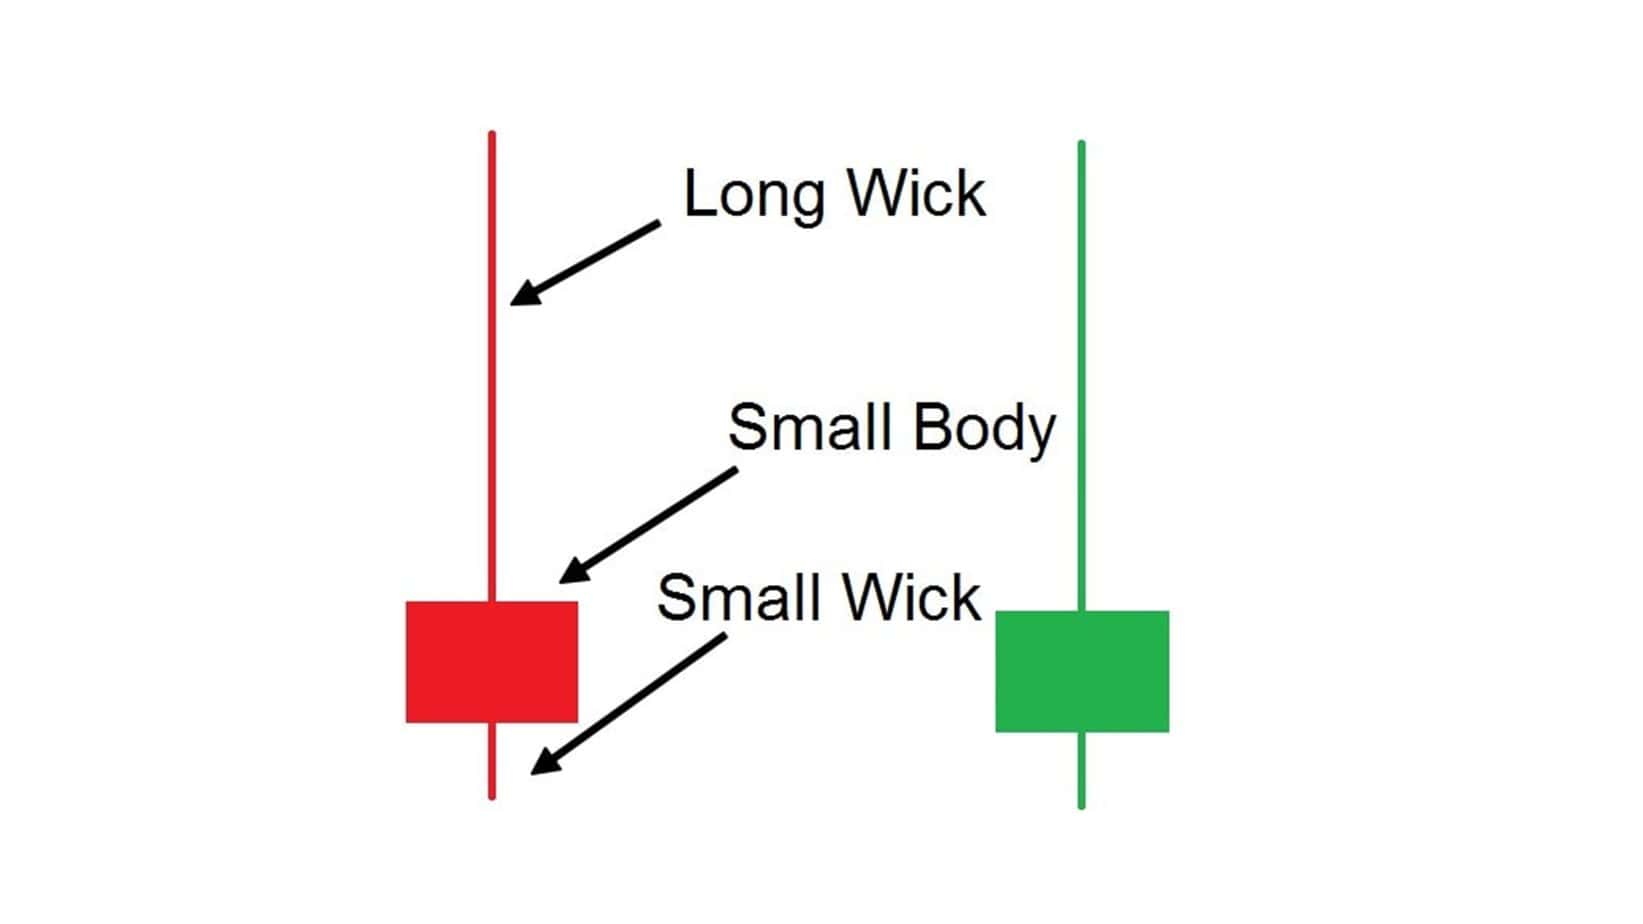
Wicks, also known as shadows, represent the high and low prices reached during a specific period on a candlestick chart. Although they provide helpful information, sometimes wicks can create visual noise, leading to confusion, especially when traders try to read the market structure or price action. Removing wicks can help traders gain a more focused perspective, reducing distractions caused by price spikes or sudden movements.
This guide will walk you through removing wicks in both TradingView and MetaTrader (MT4 and MT5), offering insights into why you might want to use this technique in your technical analysis.
Please watch my video with full instruction:
Why Remove Wicks from Your Charts?
Wicks can sometimes disrupt a chart’s visual clarity, particularly when using candlestick patterns. Traders who focus on price action may find that wicks obscures key market structure points, leading to indecision or missed opportunities.

Here are some benefits of removing wicks:
- Simplified Market Structure: Without the distraction of wicks, traders may find it easier to identify critical levels such as support, resistance, and trend lines.
- Less Noise in Range-Bound Markets: In markets with tight trading ranges, wicks can often represent temporary spikes or fluctuations that don’t reflect market sentiment.
- More Consistent Signals: Removing wicks may help traders focus solely on the candle’s body, where the open and close prices reside, offering a cleaner signal for trend identification.
Removing Wicks in TradingView
TradingView offers a straightforward method for removing wicks from candlestick charts. The platform’s flexible chart customization options make it ideal for traders looking to tweak the visual representation of their charts.
Steps to Remove Wicks on TradingView
- Open TradingView and Load Your Chart: Navigate to the chart you want to modify.
- Right-click on the Chart: This will create a context menu with various options.
- Select ‘Settings’: A pop-up window will appear.
- Go to the ‘Symbol’ Tab: You will see multiple tabs under the ‘Settings’ window. Choose the ‘Symbol’ tab.
- Find the ‘Wick’ Option: This section contains settings related to the candles’ appearance, including body, borders, and wick options.
- Uncheck the ‘Wick’ Box: Uncheck this box to remove the wicks from your chart.
- Click ‘OK’: This will apply the changes, leaving you with a chart that shows only the candle bodies without the wicks.
By following these steps, your TradingView chart will present a cleaner view, potentially allowing you to interpret market structure more accurately. This can be especially useful for traders focused on consolidation zones or critical price levels.
Removing Wicks in MetaTrader 4 and MetaTrader 5
Unlike TradingView, MetaTrader 4 (MT4) and MetaTrader 5 (MT5) do not provide a built-in feature to remove wicks from charts easily. However, a workaround allows you to effectively “hide” the wicks by modifying the chart’s color settings.
Steps to Remove Wicks on MetaTrader 4/5
- Open MetaTrader and Load Your Chart: Select the chart you want to modify.
- Right-click on the Chart: A context menu will appear.
- Choose ‘Properties’: This will open a window where you can adjust the chart’s appearance.
- Navigate to the ‘Colors’ Tab: This section lets you modify the colors of various chart components.
- Modify the ‘Bar Up’ and ‘Bar Down’ Colors: Change the ‘Bar Up’ and ‘Bar Down’ (which represent wicks) to the same color as your chart background. For example, if your chart background is black, set the ‘Bar Up’ and ‘Bar Down’ colors to black.
- Customize Candle Colors: You can also modify the colors of the candle bodies by adjusting the ‘Bull Candle’ and ‘Bear Candle’ settings.
- Click ‘OK’: Once you’ve made these adjustments, the wicks will be hidden, and only the candle bodies will remain visible on your chart.
While this method hides the wicks, it does not technically remove them from the chart’s data. However, from a visual perspective, you will no longer see them.
Why MetaTrader Does Not Offer Built-In Wick Removal
Unlike TradingView, MetaTrader’s primary focus is providing technical tools for traders without extensive customization of chart visuals. The platform lacks a native function to remove wicks, and the workaround involves manipulating the chart’s color scheme.
MetaTrader was built primarily for forex and CFD trading, where wicks often represent vital data points, such as price extremes during a particular period. For this reason, MetaTrader does not prioritize visual options like wick removal as much as platforms like TradingView, which are widely used for more extensive technical analysis across various asset classes.
Conclusion
Removing wicks from your charts can help simplify price action analysis by eliminating distractions caused by extreme highs and lows that may not be relevant to your trading strategy. On TradingView, this is a quick and easy process, but on MetaTrader 4 or 5, it requires a bit of a workaround by adjusting the color settings.
Here’s a summary of the process:
- On TradingView: Right-click on the chart > Go to Settings > Symbol Tab > Uncheck ‘Wick’.
- On MetaTrader 4/5: Right-click on the chart > Go to Properties > Change the color of ‘Bar Up’ and ‘Bar Down’ to match the background color.
This method can be highly beneficial for traders who rely heavily on price action and market structure analysis, as it reduces noise and helps focus on key trends. However, remember that wicks represent significant price information, especially in volatile markets, so using this technique should align with your overall trading strategy.
By following these steps, you can tailor your charting experience to suit your needs. This allows you to focus more on core price movements and less on distracting price spikes or anomalies.


