Table of Contents
SMB Capital, a proprietary trading firm founded by Mike Bellafiore and Steve Spencer, often shares insights into their trading strategies via books, blog posts, and YouTube videos. While they don’t publish full strategies in step-by-step detail (because most are discretionary and based on context), they do frequently talk about mean reversion trades, especially in stocks or ETFs that are overextended intraday or near key levels.
Here’s an example of a Mean Reversion Strategy from SMB’s style that resembles what Steve Spencer or Bella might teach for intraday equities:
Market Type
-
Best during range-bound or low-trending markets
-
Works well during mid-day chop or post-earnings reactions
Instrument
-
US Equities (e.g., AAPL, AMD, NVDA)
-
Volatile tickers with high relative volume
-
ATR > 1.5 and above-average daily range
ENTRY RULES
1. Identify Overextension from VWAP:


-
Price is extended >2% away from VWAP (Volume Weighted Average Price)
-
The stock moved sharply in the morning session due to news, earnings, etc.
-
RSI(2) or RSI(5) is above 90 (for short) or below 10 (for long)
2. Look for a Parabolic Exhaustion Candle (on 1-min or 5-min):
-
A strong move ending in a long wick candle
-
Decreasing volume on final thrust = potential exhaustion
3. Entry Criteria (Short Example):
-
Price is +2% or more above VWAP
-
RSI(2) > 90
-
Exhaustion candle on the 5-min chart
-
Enter short at the close of the exhaustion candle or next lower high
4. Stop Loss:
-
Place stop above the high of the exhaustion candle
-
Alternatively, a fixed % stop (e.g., 0.5% above entry)
5. Profit Target:

-
First target = VWAP
-
Second target = minor support or pre-market high/low
-
Optional: trail stop once price reaches VWAP
Example (hypothetical)
-
Stock: $AMD
-
News: Earnings beat, gapped up 5%
-
10:15am: Stock is now +7% from previous close, +2.5% from VWAP
-
RSI(2) = 95
-
You see a doji or shooting star candle on the 5-min chart
-
Enter short at $137.80, with VWAP at $134.80
-
Stop at $138.30
-
Target: $135.00 (VWAP), then $134.20
Optional Filters (SMB traders often use):
-
Check relative volume > 2x average
-
Use level 2 tape reading to confirm slowing momentum
-
Use daily chart context – e.g., is price near resistance?
Here’s a powerful and practical fundamental stock trading strategy used by professional traders and hedge funds—including styles seen from firms like SMB Capital, Fundstrat, or even Bill Ackman-type swing traders.
This strategy is built around fundamental catalysts, earnings growth, and institutional buying signals, with clear technical entry rules.
Strategy Name: Earnings + Volume Breakout (E+VB)
Type: Swing trade (multi-day to multi-week)
Focus: US stocks with strong fundamentals
FUNDAMENTAL CRITERIA (SCREENING)
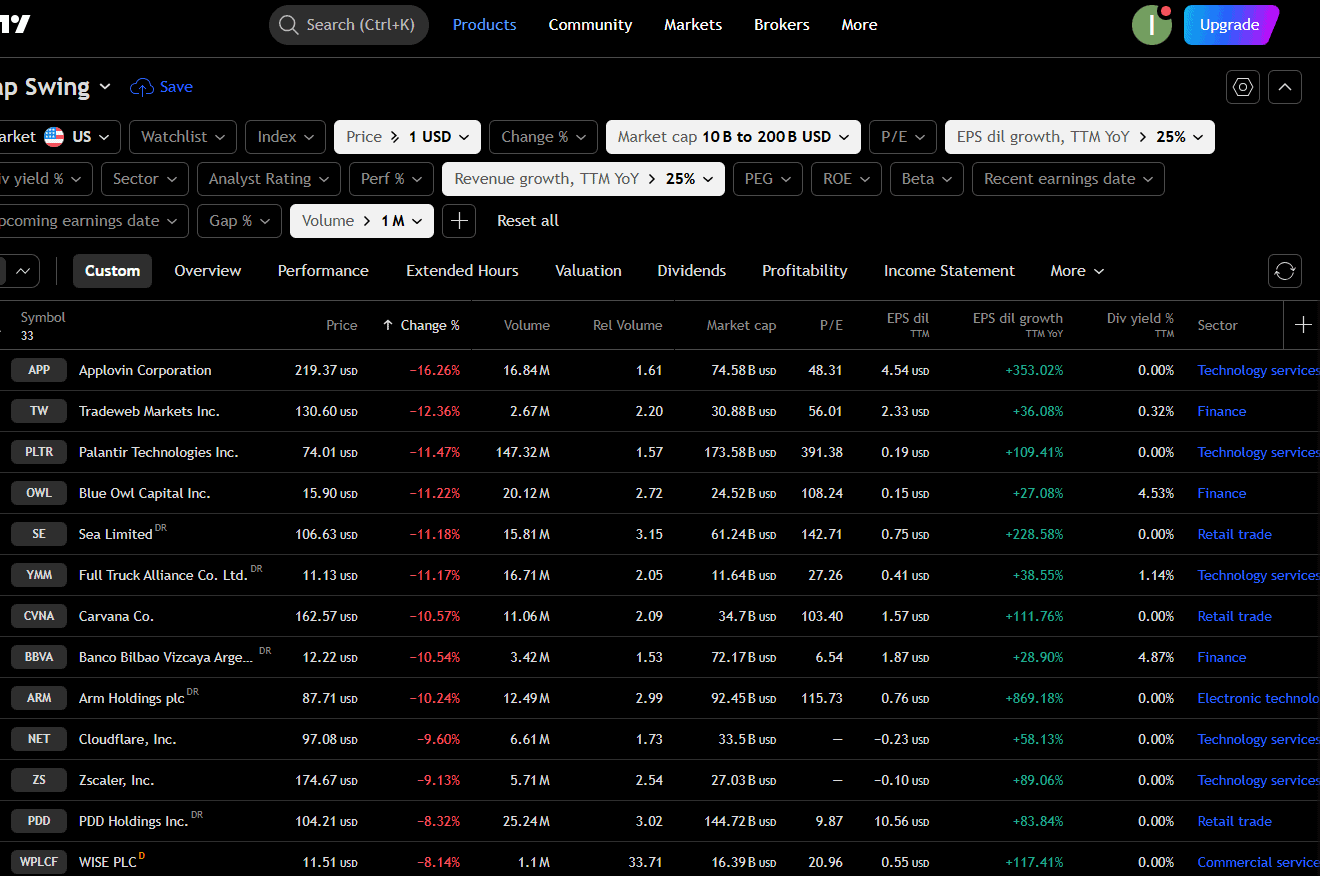
1. EPS Growth:
-
Quarterly EPS growth > 25% YoY
-
OR last earnings beat estimates by >10%
2. Revenue Growth:
-
Quarterly sales growth > 25% YoY
3. Institutional Ownership:
-
Institutions increasing holdings this quarter
-
Look for 13F filings, insider buying, or fund inflows
4. Sector Leadership:
-
Stock is in a leading sector/industry (e.g., AI, semiconductors, biotech)
5. Market Cap Filter:
-
$2B preferred (but can go lower if liquidity is good)
You can use Finviz, Seeking Alpha, or MarketSmith to screen for these.
? ENTRY RULES (TECHNICAL TRIGGER)
Chart timeframe: Daily
1. Look for recent earnings breakout:
-
Big green candle with > 150% average daily volume
-
Closes above prior 30-day high
2. Buy on 2nd day continuation or pullback:
-
Entry A: Buy at break of high of earnings candle (momentum entry)
-
Entry B: Buy near 50% retracement of the earnings candle if price pulls back with low volume
3. Confirm with Moving Averages:
-
Price must be above 20 EMA and 50 EMA
-
20 EMA sloping upward
? STOP LOSS
-
Entry A: Below breakout candle low (or 3-5% stop)
-
Entry B: Below retracement candle (or below 50 EMA)
? PROFIT TARGET
-
Use Risk:Reward = 1:2 or 1:3
-
Trailing stop if price keeps making higher highs
-
Optional: exit at technical resistance from weekly chart
? Example (hypothetical):
-
Ticker: $NVDA
-
Earnings beat by 25%, sales up 30%
-
Volume spike = 2.5x daily average
-
Breaks 30-day high and closes strong
-
Next day: Buy at break of high
-
Stop: Low of earnings candle
-
Target: 2-3x the risk
? Bonus Tip (Confirmation Tools)
-
Use Relative Strength (RS) line – if stock outperforms S&P 500
-
Use Accumulation/Distribution indicator – rising line = smart money buying

He is an expert in financial niche, long-term trading, and weekly technical levels.
The primary field of Igor's research is the application of machine learning in algorithmic trading.
Education: Computer Engineering and Ph.D. in machine learning.
Igor regularly publishes trading-related videos on the Fxigor Youtube channel.
To contact Igor write on:
igor@forex.in.rs
Related posts:
- Volume Weighted Average Price VWAP Strategy – VWAP indicator for Nifty
- Best Forex Pairs For Mean Reversion Strategy!
- Newsletter – Get Free Mean Reversion Strategy
- Range Trading Strategy based on Mean Reversion!
- Capital ISA – Is there Capital Gains Tax on ISAs?
- How to Read VWAP?
- Download VWAP Indicator for MT4
- VIX and Stochastic RSI Strategy – Volatility-Based Trading Strategy!
- What is Capital Market? Problems in Capital Market!
- Fibonacci Retracement Trading Strategy! – Golden Ratio Strategy!
- Trading Strategy for GBP/USD Based on GDP Reports – Boom Crash strategy
- What Does Sustaining Capital Reinvestment Mean?
