Table of Contents
Detailed Explanation of the Pine Script and Its Buy/Sell Rules
This script is written in Pine Script v5, which is used for developing custom technical indicators and strategies in TradingView. The script, named “Purple Cloud [MMD]”, is designed to display buy and sell signals using a combination of Supertrend, VWMA (Volume-Weighted Moving Average), ATR (Average True Range), and EMA (Exponential Moving Average).
Check my video:


1. Script Structure Overview
The script follows this structure:
- Indicator Initialization: Defines the script’s properties, like name and overlay.
- Supertrend Calculation: Uses ATR to create the Supertrend indicator.
- ATR-Based Bands Calculation: Computes upper and lower bands based on ATR and a smoothing factor.
- VWMA-Based Calculation: Uses volume-weighted moving averages for price trend filtering.
- Buy and Sell Logic: Compares calculated levels to define buy and sell conditions.
- Signal Plotting: Displays buy/sell labels on the chart.
- Optional EMAs: Provides optional EMA indicators (20, 50, 200-period).
- Alert Conditions: Creates alerts for buy/sell signals.
2. Detailed Breakdown of Each Section
2.1 Indicator Initialization
- The script runs on Pine Script v5.
overlay=trueensures that the indicator is plotted on the price chart instead of in a separate pane.
2.2 Supertrend Calculation
atrPeriod(default 10) is the length of ATR used in Supertrend calculations.factor(default 3.0) defines the multiplier for ATR.- The built-in
ta.supertrendfunction computes the Supertrend line and its direction:direction > 0? Uptrenddirection < 0? Downtrend
2.3 ATR-Based Bands Calculation
- ATR Bands:
x2 = ta.atr(x1) * alpha? ATR is smoothed using an alpha factor (0.7).xh = close + x2? Upper Band.xl = close - x2? Lower Band.
- Buy/Sell Thresholds:
bpt = 1.4%,spt = 1.4%? Define thresholds for price deviation.
2.4 VWMA-Based Calculation
- VWMA (Volume-Weighted Moving Average) Calculations:
a1? VWMA using ¼ ofx1period.a2? VWMA using ½ ofx1period.a3? Difference-based adjustment.a4? Final VWMA smoothing overx1period.
2.5 Adaptive Moving Average Calculation
b1is a Simple Moving Average (SMA) initialized at0.0.- The final VWMA-weighted adaptive moving average is
a5.
3. Buy and Sell Rules
Buy Condition
A buy signal occurs when:
a5 <= xl? Price is near or below the lower ATR band.close > b1 * (1 + bpt * 0.01)? Price is rising above the SMA by at least 1.4%.
Sell Condition
A sell signal occurs when:

a5 >= xh? Price is near or above the upper ATR band.close < b1 * (1 - spt * 0.01)? Price is falling below the SMA by at least 1.4%.
3.1 Trend State Calculation
- The
xsvariable tracks trend states:1? Buy condition.-1? Sell condition.- Otherwise, retains previous state.
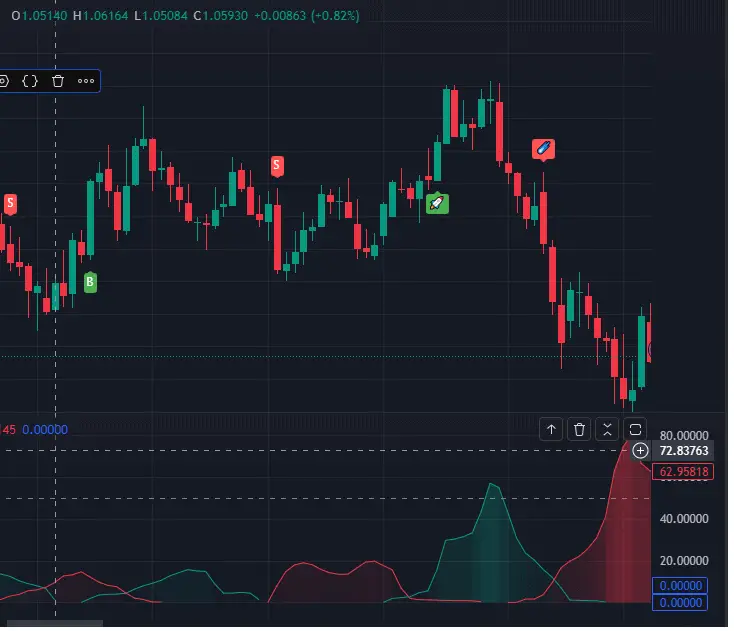
4. Signal Display
- Green bars for buy signals.
- Red bars for sell signals.
4.1 Buy/Sell Labels
- Labels are plotted only when the trend changes.
"B"for buy signals."S"for sell signals.
4.2 Strong Buy/Sell Labels (Using Supertrend)
- Strong Buy occurs when:
- Buy signal + Supertrend is in a downtrend.
- Strong Sell occurs when:
- Sell signal + Supertrend is in an uptrend.
5. Optional EMA Plots
- The script optionally plots EMA (200, 50, 20).
6. Alerts for Buy/Sell
- Alerts trigger when trend shifts.
Conclusion
This script combines Supertrend, ATR bands, VWMA-based trend filtering, and EMAs to generate buy and sell signals with trend confirmation.

Trader at Leanta Capital
Igor has been a trader since 2007. Currently, Igor works for several prop trading companies.
He is an expert in financial niche, long-term trading, and weekly technical levels.
The primary field of Igor's research is the application of machine learning in algorithmic trading.
Education: Computer Engineering and Ph.D. in machine learning.
Igor regularly publishes trading-related videos on the Fxigor Youtube channel.
To contact Igor write on:
igor@forex.in.rs
Related posts:
- One Rule Simple TradingView Strategy – Trade the Previous Day High/Low (With Free Code!)
- Convert TradingView Indicator to MT4 or MT5!
- The Best Elliott Wave Indicator on TradingView
- The Best Buy Sell Signal Indicator in TradingView!
- How to Use Volume Profile Indicator on TradingView for Free?
- How to Connect TradingView and Metatrader? – Send Alerts From TradingView to Mt4 & MT5
- VIX 75 Indicator in Tradingview!
- How to Use TradingView Multiple Chart Layouts for Free? – Get TradingView Premium Feature for Free!
- How to Use Ichimoku Cloud in Forex?
- Can I Trade on TradingView App?
- Metatrader vs. TradingView
- The Best TradingView Broker!
