Table of Contents
Forex analysis is crucial for traders and investors seeking insights into the foreign exchange market. By analyzing economic and financial indicators, market trends, and other factors, traders can identify potential trading opportunities and make more informed decisions about when to buy or sell currencies. There are two main types of Forex analysis: fundamental and technical, each with its own set of techniques and tools. While Forex trading carries significant risk, applying Forex analysis can help traders manage risk and potentially increase their chances of success.

How do quants trade forex?
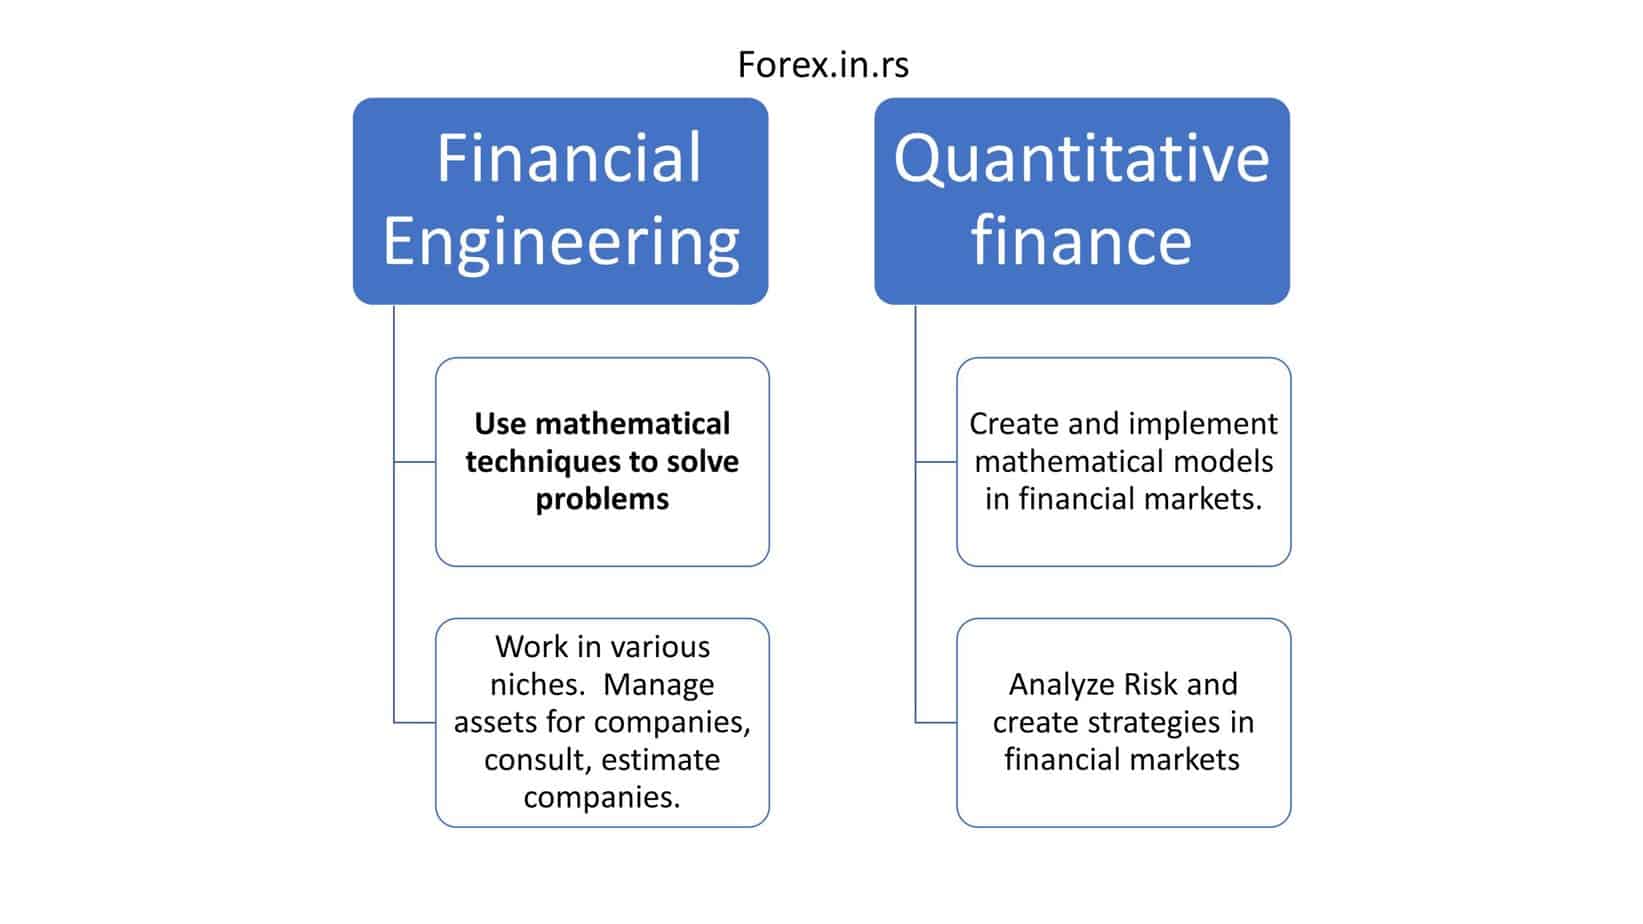
Quant forex or quantitative trading is based on statistical models and mathematical computations where traders identify trading opportunities. With quantitative analysis, traders can easily avoid emotion from investing. The approach of quantitative research is that it can simply focus on probabilities and statistics over gut feelings. Forex quantitative trading is based on mathematical forex strategy.
Quants, or quantitative traders, use a data-driven approach to trading forex that involves analyzing large amounts of data and using complex algorithms to identify trading opportunities. Here are some common steps that quants may take when trading forex:
- Collect and analyze data: Quants rely heavily on data to inform their trading decisions, so the first step is to collect and analyze large amounts of data on currency exchange rates, economic indicators, and other relevant factors.
- Develop trading models: Based on their data analysis, quants will develop trading models that use algorithms to identify patterns and trends in the market. These models may be based on technical indicators, news events, or sentiment analysis.
- Backtesting: Before deploying their trading models in the live market, quants will typically backtest them using historical data to ensure they are effective and accurate.
- Trade execution: Once a trading model has been developed and backtested, quants will use automated trading platforms to execute trades based on the signals generated by the model.
- Risk management: As with any form of trading, risk management is crucial for quants. They will use various techniques to manage risks, such as position sizing, stop-loss orders, and other risk management tools.
Provided with computers, other sophisticated technologies, and other math models, the quantitative analysis took over Wall Street, and the majority of new employees and traders at the WallStreets and those with a quantitative analysis mindset. Quantitative analysis also holds a unique position in the Forex market, similar to various other needs.
Most likely, you’ll be familiar with various other quantitative analysis forms even if you’re not considering yourself quant; who would have approached markets from the quantitative standpoint? A simple finance ratio like earnings for one share, wrist reward, and anything more complex, such as discounted cash flow, pricing, and different quantitative analysis forms.

What is Forex Quantitative Analysis?
Forex quantitative analysis is a data-driven approach to trading forex that uses advanced algorithms and mathematical models to identify profitable trading opportunities. Quantitative analysts, or quants, rely on large amounts of data, such as currency exchange rates, economic indicators, and other relevant factors, to develop trading models that can be used to generate signals for buying or selling currencies.
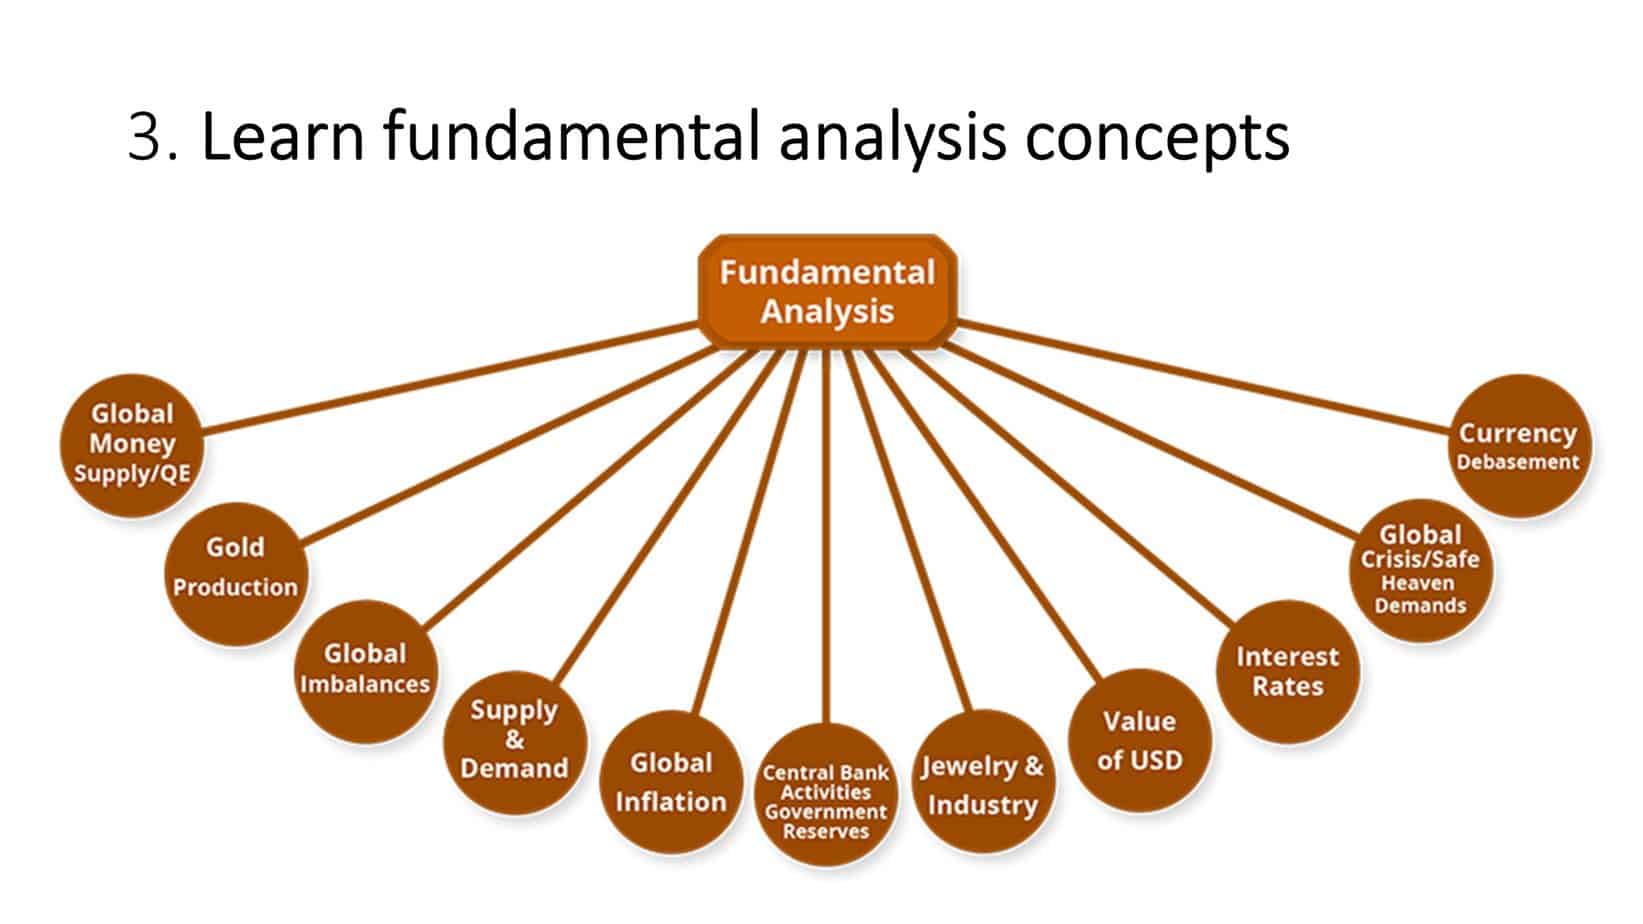
Two main types of quantitative analysis are used in forex trading: technical analysis and fundamental analysis. Technical analysis involves analyzing historical price and volume data to identify patterns and trends in the market. In contrast, the entire study analyzes economic and financial indicators to identify factors that can impact currency exchange rates.
Quants use various techniques and tools to analyze data and develop trading models, such as machine learning, artificial intelligence, and statistical analysis. They also use risk management strategies to help minimize potential losses.
While quantitative forex analysis can be highly effective, it requires significant skill, knowledge, and resources and may not suit all traders. Therefore, it’s essential to carefully evaluate the risks and benefits of this approach before using it to trade forex.
Quantitative Analysis Trading example
Suppose a quantitative analyst has developed a trading model based on technical analysis of currency exchange rates. The model uses machine learning algorithms to identify patterns and trends in the market and generates buy or sell signals based on these patterns.
The analyst backtests the model using historical data and determines its high probability of success. They then deploy the model in the live market using an automated trading platform.
For example, a quantitative analyst may use fundamental analysis to analyze interest rate differentials, inflation rates, GDP growth, and other macroeconomic indicators that can impact currency exchange rates. Then, they may combine this with technical analysis to develop a more comprehensive trading strategy.
Using both fundamental and technical analysis, quantitative analysts can gain a complete picture of the market and potentially identify more profitable trading opportunities. However, it’s important to note that there are limitations and potential drawbacks to both types of analysis, and it’s essential to carefully evaluate the risks and benefits of any trading strategy before implementing it.
The model generates a buy signal for the EUR/USD currency pair, indicating that the analyst should buy euros and sell US dollars. The analyst follows the movement and enters a long position on the EUR/USD pair.
As the market moves in the analyst’s favor, they use risk management techniques such as stop-loss orders to minimize potential losses. They also closely monitor the market and adjust their position as needed.
Eventually, the market moves in the analyst’s favor, and they exit the position at a profit. The analyst’s use of forex quantitative analysis allowed them to identify a profitable trading opportunity and manage risk effectively, resulting in a successful trade.
- Step 1: Using the methodology, statistical analysis, and science research papers forex quant, try to define strategy. Here is an example of ANANTA methodology quant forex strategy.
- Step 2: After programming, quant creates backtesting and gets the first results.
For example, backtesting results from fx-quant.com. - Step 3: After testing, live trading will start.
Results usually are worse than from backtesting. See an example of fx-quant.com live trading results.
Some examples of statistical or quantitative analysis
For this purpose, you won’t need a doctorate or math whiz in econometrics to benefit from the statistical analysis. Also, with statistics, you’re looking at the random variable dataset association.
Common statistical correlations and analysis can benefit traders, referring to broad statistical dependence and relationships. For example, one common correlation in the FX market would be the dollar weakness correlated with the emerging markets’ weaknesses—other inter-market relationships Yen strength and weakness of the equity market.
Statistical analysis has been constructive for determining future probabilities, but this doesn’t easily get forecasted. One general statement would be that correlation can mean clear cause-and-effect, while correlation means prospective everyday movements set between two random variables.
The correlation coefficient is about -1 to +1. Still, a negative one would mean correlation or an inverse relationship; zero is zero correlation. So we get a perfect positive correlation with the positive one, similar to two markets and variables that have been handcuffed.
Mathematical models are a vital tool used in trading to analyze market data and identify potential trading opportunities. These models use statistical analysis and mathematical formulas to identify patterns and trends in the data and make predictions about future market movements.
Many different types of mathematical models are used in trading, including linear regression models, Bayesian models, neural networks, and machine learning algorithms. Each model has its strengths and limitations, and traders may use multiple models to gain a more comprehensive view of the market.
Some examples of how mathematical models can be used in trading include:
- Predicting market movements: Mathematical models can analyze historical market data and predict future market movements. For example, a linear regression model could be used to predict the future price of a stock based on its historical price data.
- Identifying trading signals: Mathematical models can be used to identify trading signals based on patterns in the data. For example, a machine learning algorithm could identify patterns in a particular stock’s price and volume data and generate trading signals based on those patterns.
- Risk management: Mathematical models can be used to manage risk in trading by calculating a trade’s potential risk and reward. For example, a trader could use a risk management model to calculate a particular trade’s optimal position size and stop-loss order.
Forex regression analysis in quantitative analysis
Another favorable statistical analysis has called regression analysis.
Forex regression analysis is a set of statistical processes for estimating the relationships between a dependent variable (close price in forex regression ) and one or more independent variables or features (indicator values, RSI value, moving average value, etc. ). This is among the most favorable statistical models and other quantitative analyses for letting you determine the relationship between the variables and variables that are one and more dependent. Specifically, with regression analysis, you can understand how typical dependent value alters while either of the independent variables is varied.
Many charting packages for Forex are available with regression channels that do regression analysis calculation, and it is pretty simple to access compared to correlations.
With regression analysis, you can commonly estimate conditional expectations or also a dependent variable provided independent variable. This means the relative value of the average dependent variable to the fixed independent variable. Often this has been shown in sloping lines lower or higher, cutting through the prices in the trend direction or sideways move regression line would usually be flat.
While many mathematical models remain out of scope here, many traders mainly utilize Excel through Microsoft. For example, the correlation function is used between variables over a specific time set to determine whether there has been a negative or positive correlation.
However, many research outlets put off correlation reports, which can easily be discovered in different research terminals such as Reuters and Bloomberg.
If you remain interested in having such model types by yourself, it would be vital to note that all outcomes are data-driven, and incomplete or missing data would lead your field. Therefore, you must be careful about missing data first to have an efficient analysis; you must take care of missing data at first to analyze data. Most probably, excel will remain the best bet while doing data analysis. Still, many brokers offer tools that help do different types of research for quant forex trading.
The statistical analysis wraps the head seemingly around random variables for the pattern that can be traded. Of course, risk can always get managed, but such patterns last for a longer time without existing casually. While this would seem similar, backtesting can become a proverbial wolf in sheep’s clothing, often quantitative or statistical analysis.
This pays to remain aware regarding back-testing getting pitched as statistical modeling. Often, the backtesting would be done for over-idealizing data sets that bring over-leveraging, false confidence, and prospectively massive losses when the current environment deviates through the data set.


