Table of Contents
To effectively trade using the US Dollar Index (DXY), traders can rely on it as a reference to analyze the strength of the US dollar and its impact on other currency pairs, particularly those involving USD, such as EUR/USD, GBP/USD, and AUD/USD. Here is a step-by-step guide to using the DXY to identify potential support, resistance, and breakout levels.
Please watch my video with detailed instructions:


1. Understanding the US Dollar Index (DXY)
The DXY measures the value of the US dollar against a basket of six major foreign currencies (EUR, JPY, GBP, CAD, SEK, and CHF). A rising DXY indicates a stronger dollar, while a declining DXY suggests a weaker dollar. This index is not tradable directly but is an indicator to predict movements in dollar-related pairs.
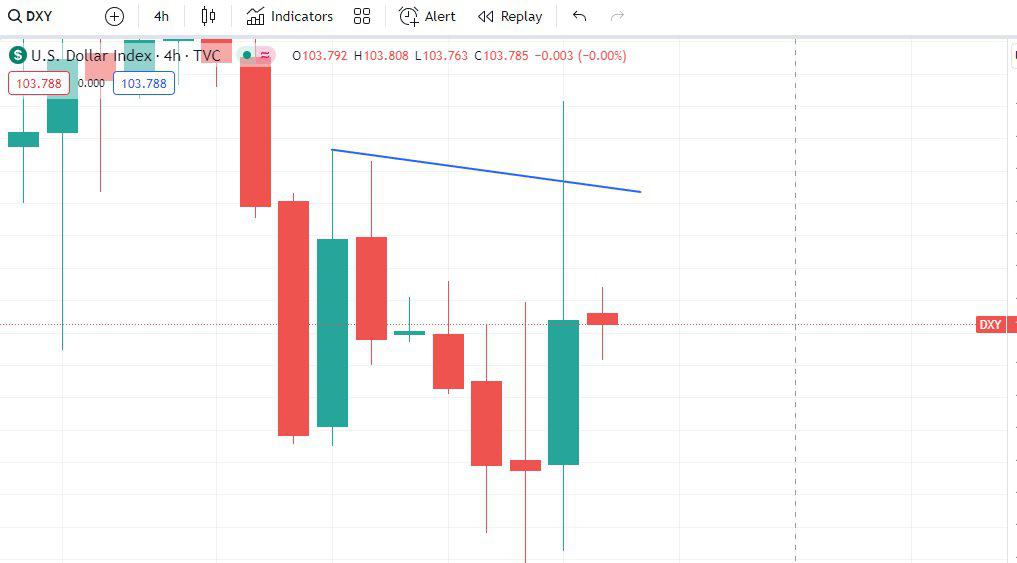
2. Identifying Key Levels on the DXY
In this example, the price of the DXY reached a recent high of 102.619. We begin by analyzing this high to find potential support or resistance levels.

- Drawing Trendlines: Trendlines connecting the high points on the DXY can be drawn. For instance, by connecting the high from a Monday session and another peak (such as Tuesday morning), we create a visible trendline that acts as a resistance level.
- Candlestick Analysis: If you prefer precision, one strategy is to remove wicks from the candlesticks in your chart settings, allowing you to focus solely on the candle’s body. This helps you identify the most accurate price levels for trendline placement, especially when trading based on the bodies instead of temporary price spikes (wicks).
3. Waiting for a Trendline Touch
Once the trendline is set, the next step is to wait for the price to approach this trendline. The price and trendline interaction provides valuable information about potential breakouts or reversals.
- Example from the Transcript: In the example provided, the trader waited for the price to touch the trendline again, which happened about 15 minutes before the analysis. This touch confirms the resistance or support at that level and can be a signal for a potential entry.
4. Analyzing for Breakouts
Once the DXY price reaches the trendline, there are two possibilities:
- Reversal: If the price touches the trendline and reverses direction, the trendline is holding as resistance or support. Traders can then consider entering a position opposite to the DXY.
- For instance, if DXY touches a resistance trendline and reverses downward, a trader might look to buy GBP/USD or EUR/USD, anticipating a weaker dollar.
- Breakout: If the DXY breaks above the trendline, it may signal a stronger dollar, leading to a breakout trade. This would typically be followed by a confirmation before entering a position, as breakouts can sometimes fail.
5. Applying to Major Pairs
Because the DXY measures the dollar’s strength against a basket of currencies, any significant movement in the index will impact dollar-based pairs. In this case:
- For EUR/USD and GBP/USD: When the DXY touches the trendline and shows signs of reversing, it suggests an opportunity to go long (buy) on these pairs. A falling DXY means the dollar is weakening, leading to strength in the euro or pound relative to the dollar.
6. Confirmation with Lower Timeframes
For precision, you can use smaller timeframes, such as the 1-minute chart, to identify strong moves that confirm the reversal or breakout. Once you see a strong move in the opposite direction after the price touches the trendline, entering a trade could be your cue.
7. Exit Strategy and Target Levels
In this example, the target level for GBP/USD or EUR/USD is the previous Monday’s high, 1.3134. By targeting this level, the trader wants to capture around 40 pips, representing a favorable risk-to-reward ratio. Always be prepared to exit the trade if the price breaks through the trendline significantly, as this may invalidate your reversal strategy.
8. Patience and Waiting for the Right Moment
Patience is key. As shown in the example, the trader waits for a more favorable moment to enter the trade, avoiding premature entries when the price seems undecided. This is crucial when using the DXY to anticipate movements in other pairs, as breakouts and reversals can take time to develop.
9. Conclusion: DXY as a Powerful Tool for Forex Trading
By drawing trendlines on the DXY and monitoring how the price reacts around those levels, traders can gain insights into how USD pairs might behave. This method allows traders to predict potential resistance or support breakouts, providing strategic entry points in pairs like GBP/USD and EUR/USD. The key is to remain patient, confirm moves using shorter timeframes, and avoid entering trades prematurely until the price shows an apparent reaction at critical levels.
This approach combines technical analysis with a solid understanding of the US Dollar Index, helping traders navigate the forex market with a more informed perspective.

He is an expert in financial niche, long-term trading, and weekly technical levels.
The primary field of Igor's research is the application of machine learning in algorithmic trading.
Education: Computer Engineering and Ph.D. in machine learning.
Igor regularly publishes trading-related videos on the Fxigor Youtube channel.
To contact Igor write on:
igor@forex.in.rs
