Table of Contents
As much as it is essential to follow the movement of prices in a securities market, it is equally imperative to keep track of trading volumes. Like price movements, volumes also help traders determine the market and trader’s sentiment. As it is fundamental to understanding the market sentiment before making any trading decisions, estimating the trading volumes and price movements becomes an essential part of trading.
As we know that there are many indicators and technical tools available that can follow the price movement, the Better Volume 1.5 Indicator can assist traders in estimating the trading volumes in a Forex Market.
Please read this article to find out what the Better Volume 1.5 Indicator is, how it works and how traders can trade using this indicator.
Download MT4 Volume Indicator
Better Volume 1.5 represents the MT4 volume indicator, an improved version from the primary MetaTrader Volume indicator.
DOWNLOAD BETTER VOLUME INDICATOR

What Is the Better Volume 1.5 Indicator?
We mean the number of lots (Forex or Stocks) purchased or sold over a specific period by trading volume. Trading volumes help traders to understand the market conditions more clearly. In addition, the volumes help traders evaluate the sentiment of other traders in the market and the sentiment of the market itself.
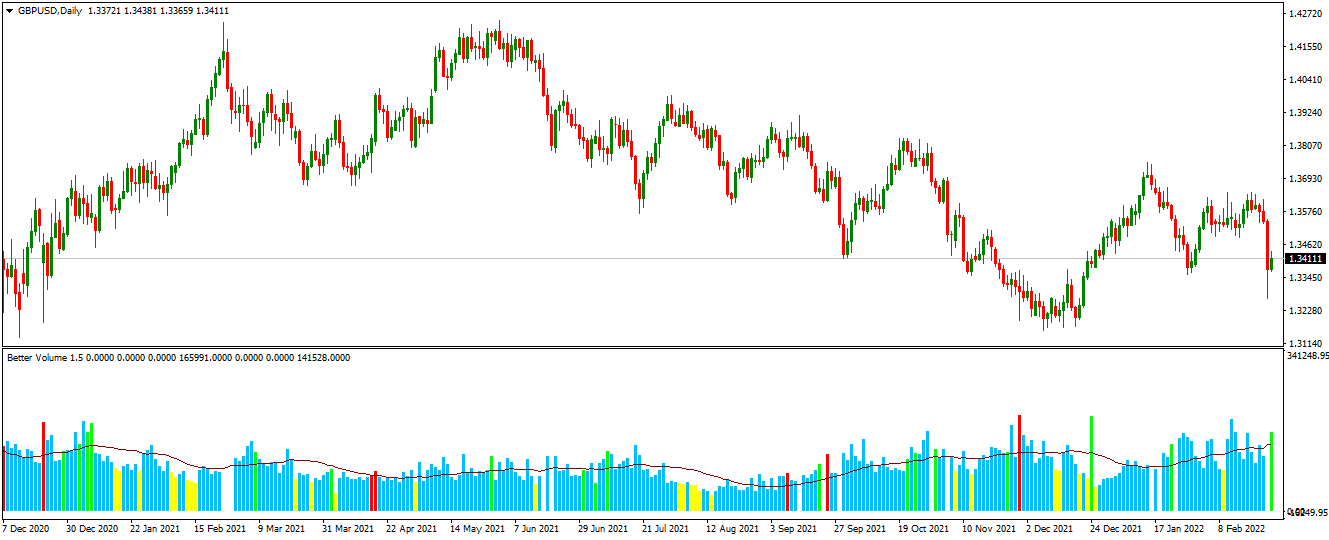
After analyzing the activity of the traders in the Forex market, the Better Volume 1.5 Indicator illustrates the volumes of the transactions traded with the help of a histogram. The volumes displayed in the histogram are the number of transactions completed by the traders in the market at a particular point in time. This means it does not include transactions that were not completed or may be made with different intentions.
Now, one more indicator, the tick volume indicator, counts the number of times the price of a traded asset changes in a period. But this indicator cannot differentiate between the price changes with the actual volume of lots traded. Therefore, the Better Volume 1.5 Indicator can solve this issue. Moreover, it will help the traders to know the motives of other traders in the market and formulate a successful trading plan.
Features of Better Volume 1.5 Indicator Histogram
What differentiates the Better Volume 1.5 Indicator from other built-in volume indicators in the MT4 terminal is more advanced and updated. Like the tick volume indicator, it displays the ups and downs of the price in a Forex chart. But, it has an add-on feature that classifies these bars into different categories. These categories are color-coordinated, and each color indicates additional information.
The following is the list of colors that can appear on the Better Volume 1.5 indicator histograms and what each color tells about the volumes:
- Red- It indicates an uplift in the activities of the customers.
- Blue- It displays the conventional volume of trading transactions.
- Green- It means there is an increase in traders’ interest in the market.
- White- It means the increased movements of the sellers in the market.
- Yellow- It suggests that the trading volumes are low.
These volume indicators provide traders with much-needed information about the market. Based on this information, they can decide when to change or open a position or retain their current position. For example, there is an increased interest in traders in the green volume zone. This could mean that the dominant traders in the market are planning to reposition. As a result, the trading volumes rise. In such a situation, traders must avoid entering a trade as there is no certainty in the market’s direction. Another example could be the yellow volume zone, where the trading volumes are low. In this situation, traders should not buy or sell any Forex as uncertainty makes the market riskier.
However, it is always advisable to consider the actual price movement and the primary trend. Therefore, using these volume indicators as one tool alone is not efficient enough to help make a robust trading plan.
How To Trade With Better Volume 1.5 Indicator?
As it has already been said, it is essential to consider both the price movement and the trading volumes to determine the market sentiments. The volume indicator helps traders get the additional information and confirm the prevailing sentiment of the market. In addition, traders can use these volume indicators to determine the buying and selling signals and where to put stop loss.
For example, traders can look for buy entry points in such signals when the buying volumes increase. The ideal position to place a stop loss is below the trend line. When in a buying position, if traders see the sell entry points forming on the chart, they can close the buying position.
Similarly, if the selling volumes increase, traders must look for a point to enter the selling position and plan to close the position if the market starts forming buying signals.
Conclusion
Installing the indicator and applying it to your MT4 terminal is an easy task. What requires traders’ efforts to understand each color of volume and what they signify. However, the Better Volume 1.5 Indicator simplifies classifying all the volume signals. Predicting the behavior of the market and other traders is essential to stay ahead in the market and make profitable trading decisions. So, this indicator can prove extremely helpful for traders to make such decisions.


