Table of Contents
The Volume Profile is a powerful tool that shows how much volume was traded at specific price levels over a given period. Unlike traditional volume bars that only track volume over time, the Volume Profile displays volume at price, giving traders insights into key levels of interest.
What Is a Volume Profile Indicator?
A Volume Profile Indicator plots horizontal bars along the price axis, showing where the most trading activity occurred. This highlights areas of high interest, which often act as key support or resistance zones.


A typical Volume Profile will include the following elements:
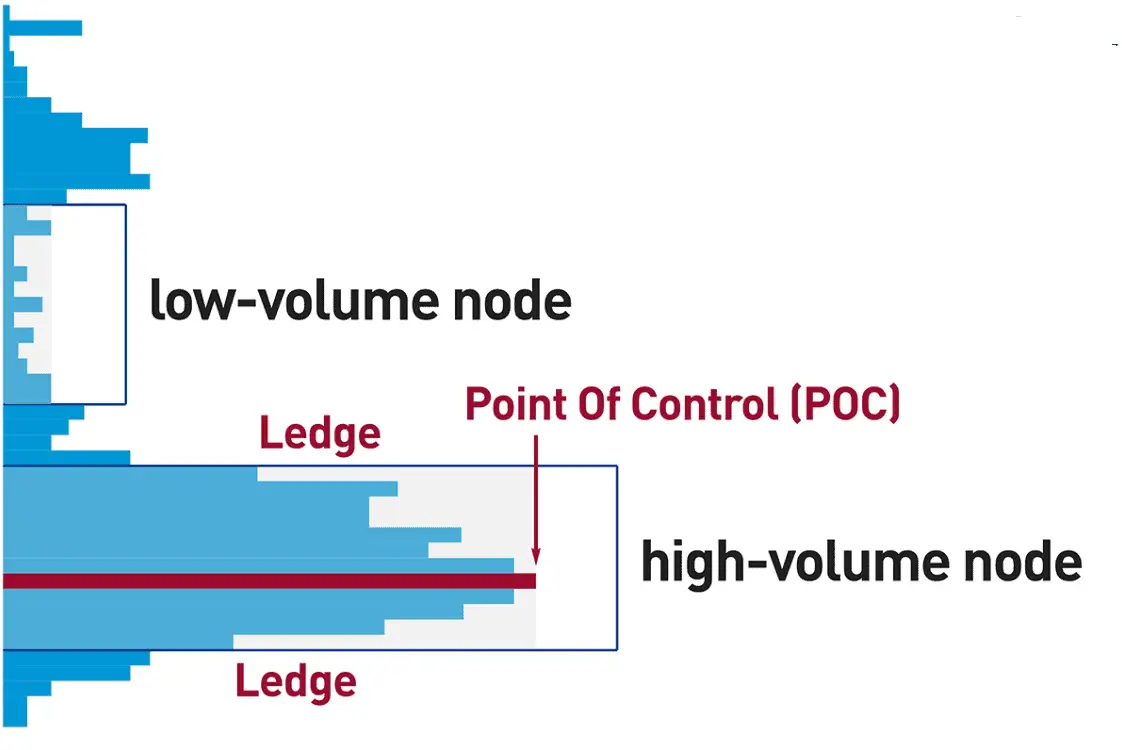
- Point of Control (POC):
- The price level with the highest traded volume in the selected timeframe.
- Acts as a strong magnet for price action.
- Value Area (VA):
- The range where 70% of total volume was transacted.
- Traders watch these boundaries for breakouts or reversals.
- High-Volume Nodes (HVN):
- Areas with significant trading activity.
- These zones often create support or resistance as traders previously showed interest here.
- Low-Volume Nodes (LVN):
- Areas with minimal trading activity.
- Price tends to move quickly through these zones due to reduced liquidity.
Why Is the Volume Profile Important in Trading?
- Identifies Key Support and Resistance Zones:
- High-volume areas often become key turning points for price action.
- Low-volume areas are prone to fast price movement, making them ideal for breakout trades.
- Confirms Breakouts and Fakeouts:
- A breakout through a high-volume node with increased volume confirms a stronger trend.
- Conversely, a breakout with low volume may indicate a potential false move.
- Spotting Accumulation and Distribution:
- Extended periods of high-volume activity often signal accumulation (bullish) or distribution (bearish) zones.
- Improved Trade Entries and Exits:
- By combining the POC and value area boundaries, traders can identify optimal entry and exit points.
Volume Profile in Forex vs. Futures Markets
The major difference between analyzing forex CFDs and futures lies in the accuracy of volume data:

Futures Market (Real Volume Data):
-
- The futures market offers true volume values since futures exchanges like CME provide centralized data for all traded contracts.
- This real volume data reflects actual buying and selling activity.
Forex CFDs (Tick Volume – Not Real Volume):
- The forex spot market is decentralized, meaning no single source provides accurate volume data.
- Most forex brokers display tick volume, which only shows the number of price changes rather than the actual number of contracts traded.
- While tick volume can still correlate with real volume, it’s less precise.
How to Use Futures Volume to Trade Forex
Since forex CFDs lack real volume data, professional traders often use futures volume profiles (e.g., EUR/USD futures on CME) to gain accurate insights:
- The 6E futures contract represents EUR/USD on the CME exchange.
- The 6J contract reflects USD/JPY.
- These futures instruments provide true volume data, which can be applied to forex CFD charts for improved decision-making.
By combining futures volume data with CFD price charts, you gain better insights into real market sentiment, improving trade accuracy.
Key Tip:
If you trade forex CFDs but want accurate volume insights, platforms like TradingView, Bookmap, or Sierra Chart allow overlaying futures volume data directly on forex charts. This technique enhances your ability to identify meaningful volume zones.
Would you like an example setup or step-by-step guidance on applying futures volume data to forex charts?
When analyzing volume profiles in low-volume sections, the optimal entry point depends on understanding the imbalance between buyers and sellers. Here’s how you can approach it:
Key Principle: Trading Against the Imbalance
- Buy when there are more sellers than buyers in a low-volume area.
- Sell when there are more buyers than sellers in a low-volume area.
Why?
- Low-Volume Areas Represent Weak Support or Resistance:
These zones indicate less market participation, meaning price can move quickly through them. - When There Are More Sellers in a Low-Volume Zone:
If sellers are overwhelming the area but price holds steady or starts to rise, this suggests absorption — stronger buyers are quietly absorbing sell orders. This can trigger a bullish move. - When There Are More Buyers in a Low-Volume Zone:
If buyers are dominant but price struggles to rise, this suggests hidden selling pressure, which can lead to a bearish move.
How to Identify the Right Conditions:
- Volume Profile Analysis:
- Focus on low-volume nodes (LVN) where price tends to move quickly.
- These areas often act as “gaps” in liquidity, meaning price may jump from one high-volume area to another.
- Order Flow Confirmation:
- Look for signs of absorption, such as large sell orders failing to push the price lower.
- Conversely, large buy orders failing to drive the price higher may indicate a bearish setup.
- Footprint Charts or Delta Analysis:
- Positive delta in a low-volume zone with price struggling to rise suggests potential short opportunities.
- Negative delta with price holding or rising signals possible long entries.
Example Scenario:
-
Low-Volume Zone with Heavy Selling Pressure:
If you see aggressive selling but the price isn’t dropping significantly, it’s a sign buyers are quietly absorbing those sell orders. This often precedes a bullish breakout. -
Low-Volume Zone with Heavy Buying Pressure:
If there’s strong buying but price shows hesitation, it often means sellers are absorbing the buying pressure — a bearish signal.
Best Practice:
Combine volume profile analysis with price action signals (e.g., bullish engulfing candles, rejection wicks, etc.) for confirmation before entering a trade.

He is an expert in financial niche, long-term trading, and weekly technical levels.
The primary field of Igor's research is the application of machine learning in algorithmic trading.
Education: Computer Engineering and Ph.D. in machine learning.
Igor regularly publishes trading-related videos on the Fxigor Youtube channel.
To contact Igor write on:
igor@forex.in.rs
Related posts:
- How Much is the Forex Market Volume Per Day? – Forex Daily Trading Volume!
- Download Free Hawkeye Volume MT4 Indicator! – How to read Hawkeye volume indicator?
- Download MT4 Volume Indicator – Better Volume Indicator
- Volume Weighted Moving Average Indicator
- Volume Weighted Average Price VWAP Strategy – VWAP indicator for Nifty
- How to Calculate Forex Volume?
- What is the Best Moving Average for Volume Chart?
- Largest Forex Brokers by Volume of 2024.
- How to Use Volume Profile Indicator on TradingView for Free?
- Best Free Volume Profile Order Flow TradingView Indicator!
- What is ADX indicator? – ADX Trading Strategy
- What is Pivot Point Trading?
