Table of Contents
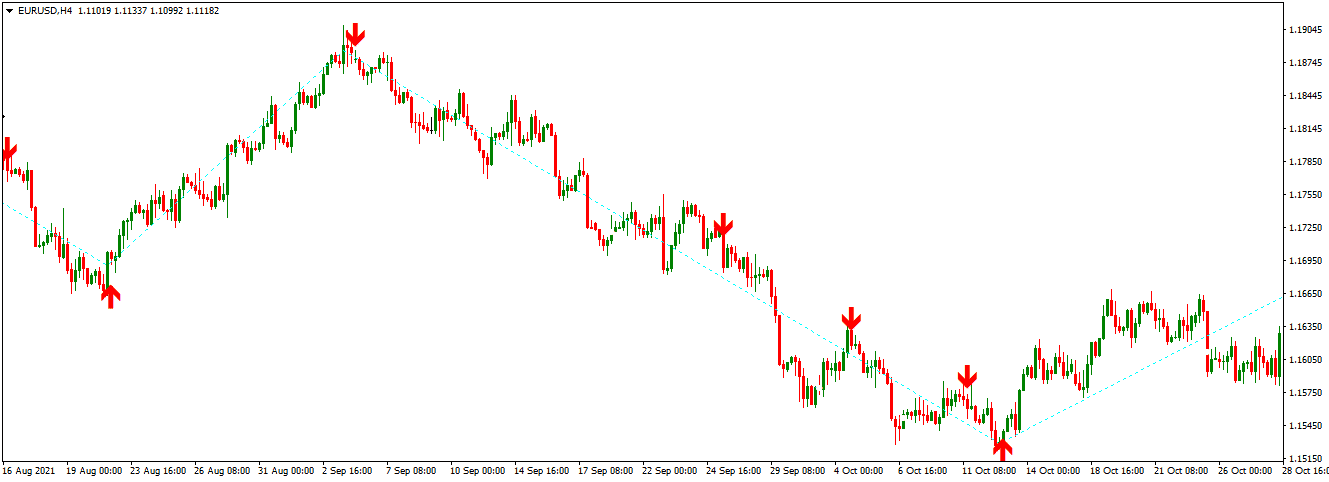
The Zig Zag Indicator based on close prices is a clear and concise price movement indicator. It is an excellent tool for spotting waves, periodic patterns, and trading market movement. The stock market doesn’t follow a logical path. Even though the price may be following a powerful trend such as an uptrend, prices are characterized by highs and lows, rises, and falls that resemble wave patterns. As a result, forecasting stock prices is a complex undertaking. The Zig Zag indicator comes into play here.
A few weeks ago we wrote an article about the Swing ZigZag indicator.
The Zig Zag breakout indicator filters out all of the market’s noise. In other terms, it shows you the precise stock-price movement from one position to the next. As a result, it facilitates the traders in visualizing the ups and downs of a particular trading session. This indicator is named Zig Zag breakout because it works on the breakout price.

Download Zig Zag Buy Sell Indicator With Alert
Below you can download the buy-sell indicator with an alert to see buy and sell arrows on the chart.
DOWNLOAD ZIGZAG BUY SELL INDICATOR
The Zig Zag indicator is also a valuable tool for determining appropriate entry points, specifically during moments of extreme volatility. In addition, it’s an excellent indicator for identifying Fibonacci levels and analyzing Elliot waves. The most pleasing aspect is that the Zigzag indicator can be used at any period and with any currency pair.
Making the most out of the Zig Zag Indicator
The Zig Zag breakout indicator for Mt4 is more of a financial background instrument than anything else. Other hands are more interactive compared to this one. To put it another way, instead of calculating or offering exact entry points, it gives general trade insights on the stock price. As a result, this is an undervalued indicator for technical analysis, as it is frequently utilized as an auxiliary instrument.
Now back to the real point; how can you use this indicator and make the most out of it? You’ll have to specify the start and finish points to utilize this indicator for a certain period. However, you do not need to set an endpoint for present transactions.
It tracks market movements while overlooking minor reversals. As a result, it can significantly assist you in recognizing market patterns such as double touch patterns and bullish-to-bearish trend reversal patterns. In addition, the Zig Zag indicator is also considered a repainting indicator. In simpler words, the indicator will be repaired whenever a new low or high is generated.
Trading signals
The Zig Zag breakout indicator for MetaTrader 4 is a one-of-a-kind indicator. It already has predefined bearish or bullish indicators in it. In addition, we can rely upon this indicator for recognizing Fibonacci levels and measuring Elliot waves. Hence, it would help if you used it for enhancing your trading techniques as an affirmation of appropriate buying and selling positions.
Example of buying and selling
Let us consider an example of a price change in four hours with default values like twelve, five, and three for the US dollar/Canadian dollar. Before hitting the latest low, 1.2086, an initial high was established at 1.2318. Before the double bottom charting pattern is generated, the prices are retraced, which creates a lower high. The double bottom charting pattern is an excellent purchase signal, so consider this. In essence, the indicator filters out the market disturbance, allowing us to discern the optimistic price trend quickly.
Final word
Ditch the use of the Zig Zag indicator individually. Instead, you can develop an overlapping convergence indicator by combining the harmonic patterns with the swing levels of the indicator. Furthermore, the market will set out minimal retracements whenever strong trends appear. Thus, you should change the settings to match the current market conditions.


